Groenlandia: calentamiento nada excepcional, según nueva investigación.
Ya lo hemos visto un montón de veces. Apenas hay datos comparativos entre el calentamiento actual en el Ártico y otros calentamientos anteriores, así que es muy difícil saber si el CO2 ha tenido alguna influencia. Hay indicios de que no gran cosa, como hemos visto por ejemplo en:
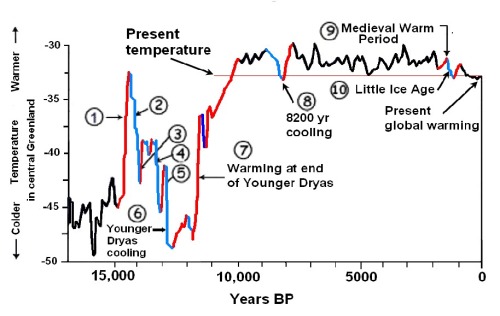
Lo que sí hemos visto es que cada vez que estudian el caso en Groenlandia, que está dentro del círculo polar y hay datos completos y fiables desde hace mucho tiempo, nos dicen que el calentamiento de ahora no tiene nada fuera de lo corriente. No es ni más abrupto, ni más intenso, ni más caliente, ni más nada que otras fases de calor de los anteriores ciclos de temperatura. Ahora hace calor, y luego hace frío, y luego otra vez ... Se llama clima, y es una cosa que cambia todo el rato según unos ciclos que apenas empezamos a comprender.Teniendo en cuenta que las variaciones de temperatura son más fuertes en las zonas circunpolares, si el CO2 tuviera en el clima la importancia que pretenden, tendrían que verse notables diferencias entre una fase de calentamiento en 1919 - 1932 y otra en 1994 - 2007, porque hay mucha diferencia en CO2 entre un momentoy otro. La diferencia en CO2 entre una fase y la otra (80 ppm) es la misma que la diferencia en CO2 entre lo más profundo (frío) de una glaciación y lo más cálido de un interglaciar. En Groenlandia, en temperatura, eso supone unos 15 ºC de diferencia:

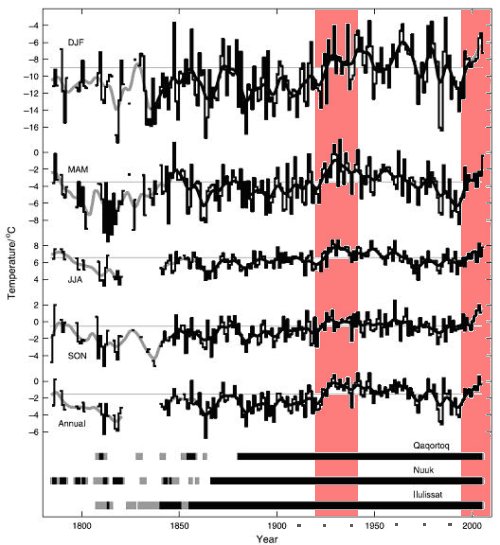
¿Y cual es la diferencia ahora Groenlandia, en temperatura, con la misma diferencia de 80 ppm de CO2? Aparentemente ninguna. Por ejemplo señalo en este cuadro de Vinther et al 2006 esos calentamientos de 1919 -32 y 1994 -2007:

Y por ejemplo este nuevo estudio reción revisado en Journal of Climate:
Greenland Ice Sheet Surface Air Temperature Variability: 1840–2007
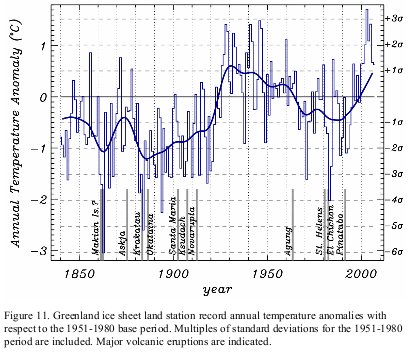
De Jason Box, Lei Yang, David Bromwich, y Le-Sheng Bai.En el que estiman que el calentamiento de 1919 -32 es una magnitud un 33% mayor que el caletemiento de 1994 - 2007 en la capa de hielo de Groenlandia.
f. Comparison of 1920s and 1990s Warming Periods
The two strongest warming periods since 1840 are identified as 1919-1932 and 1994-2007, each lasting 14 years for simplicity of comparison. Annual temperature anomalies in both cases are more than two standard deviations (2σ) above the 1951-1980 base (Figure 11). The 1919-1932 warming was larger in magnitude overall than the 1994-2007 warming; 0.6 °C greater annually for the whole ice sheet and greater regionally, in particular, by 0.6 °C in winter and 2.0 °C in spring for the northwest part of the ice sheet (Figure 12, Table 6). The 1994-2007 warming was however larger over the southern part of the ice sheet in winter, that is, by 2.4 °C (see Table 6). Differences between the 1919-1932 and 1994-2007 warming periods include that the former is marked by spring warming leading other seasons in time by a few years (Figure 10). The 1919-1932 winter warming is larger in overall magnitude, with spring reaching the most positive anomaly of all seasons. During the 1994-2007 warming, autumn leads other seasons by several years. Furthermore, for the period 1994-2007, the temperature anomaly for autumn is more positive than the other seasons. Winter is the final season to catch up to the annual average for both the 1919-1932 and 1994-2007 warming period (Figure 10). Both the 1919-1932 and the post-1993 warming coincide with an absence of volcanic cooling 17 (see Figure 11). Warming rates between the 1994-2007 and 1919-1932 periods are compared using the ratio of the change both seasonally and on a basin scale in Table 7. The greatest difference between the two warming periods is the factor of 2 or larger spring warming in 1919-1932 versus 1994-2007 (Figure 12, Table 7). In autumn, the extreme south warmed more (factor of 2.2) 1919-1932 versus 1994-2007. In contrast, the extreme southern part of the ice sheet winter warming rate was nearly two times greater during 1994-2007 than 1919-1932. If glacier response is greater in summer than winter, one might expect a greater retreat of Greenland glaciers 1919-1932 than 1994-2007. While no satellite observations are available from the 1920s, what observations exist from oblique aerial photos, maps, and paintings do indicate a 1920s-1940s Greenland glacier retreat (Box and Herrington, 2007).