Entradas y cosas útiles
Sólo es una colección de algunas entradas, propias o ajenas, que enlazo con frecuencia porque resultan de utilidad. Para tenerlas juntas a mano. Irá creciendo. También gráficos sueltos de uso frecuente.
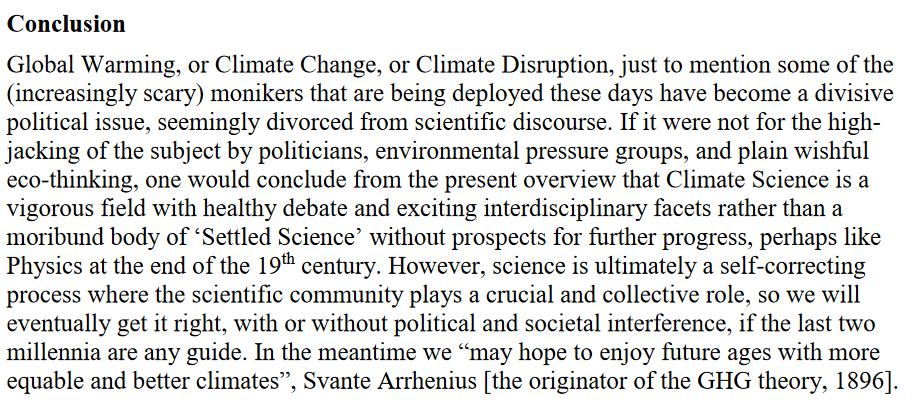
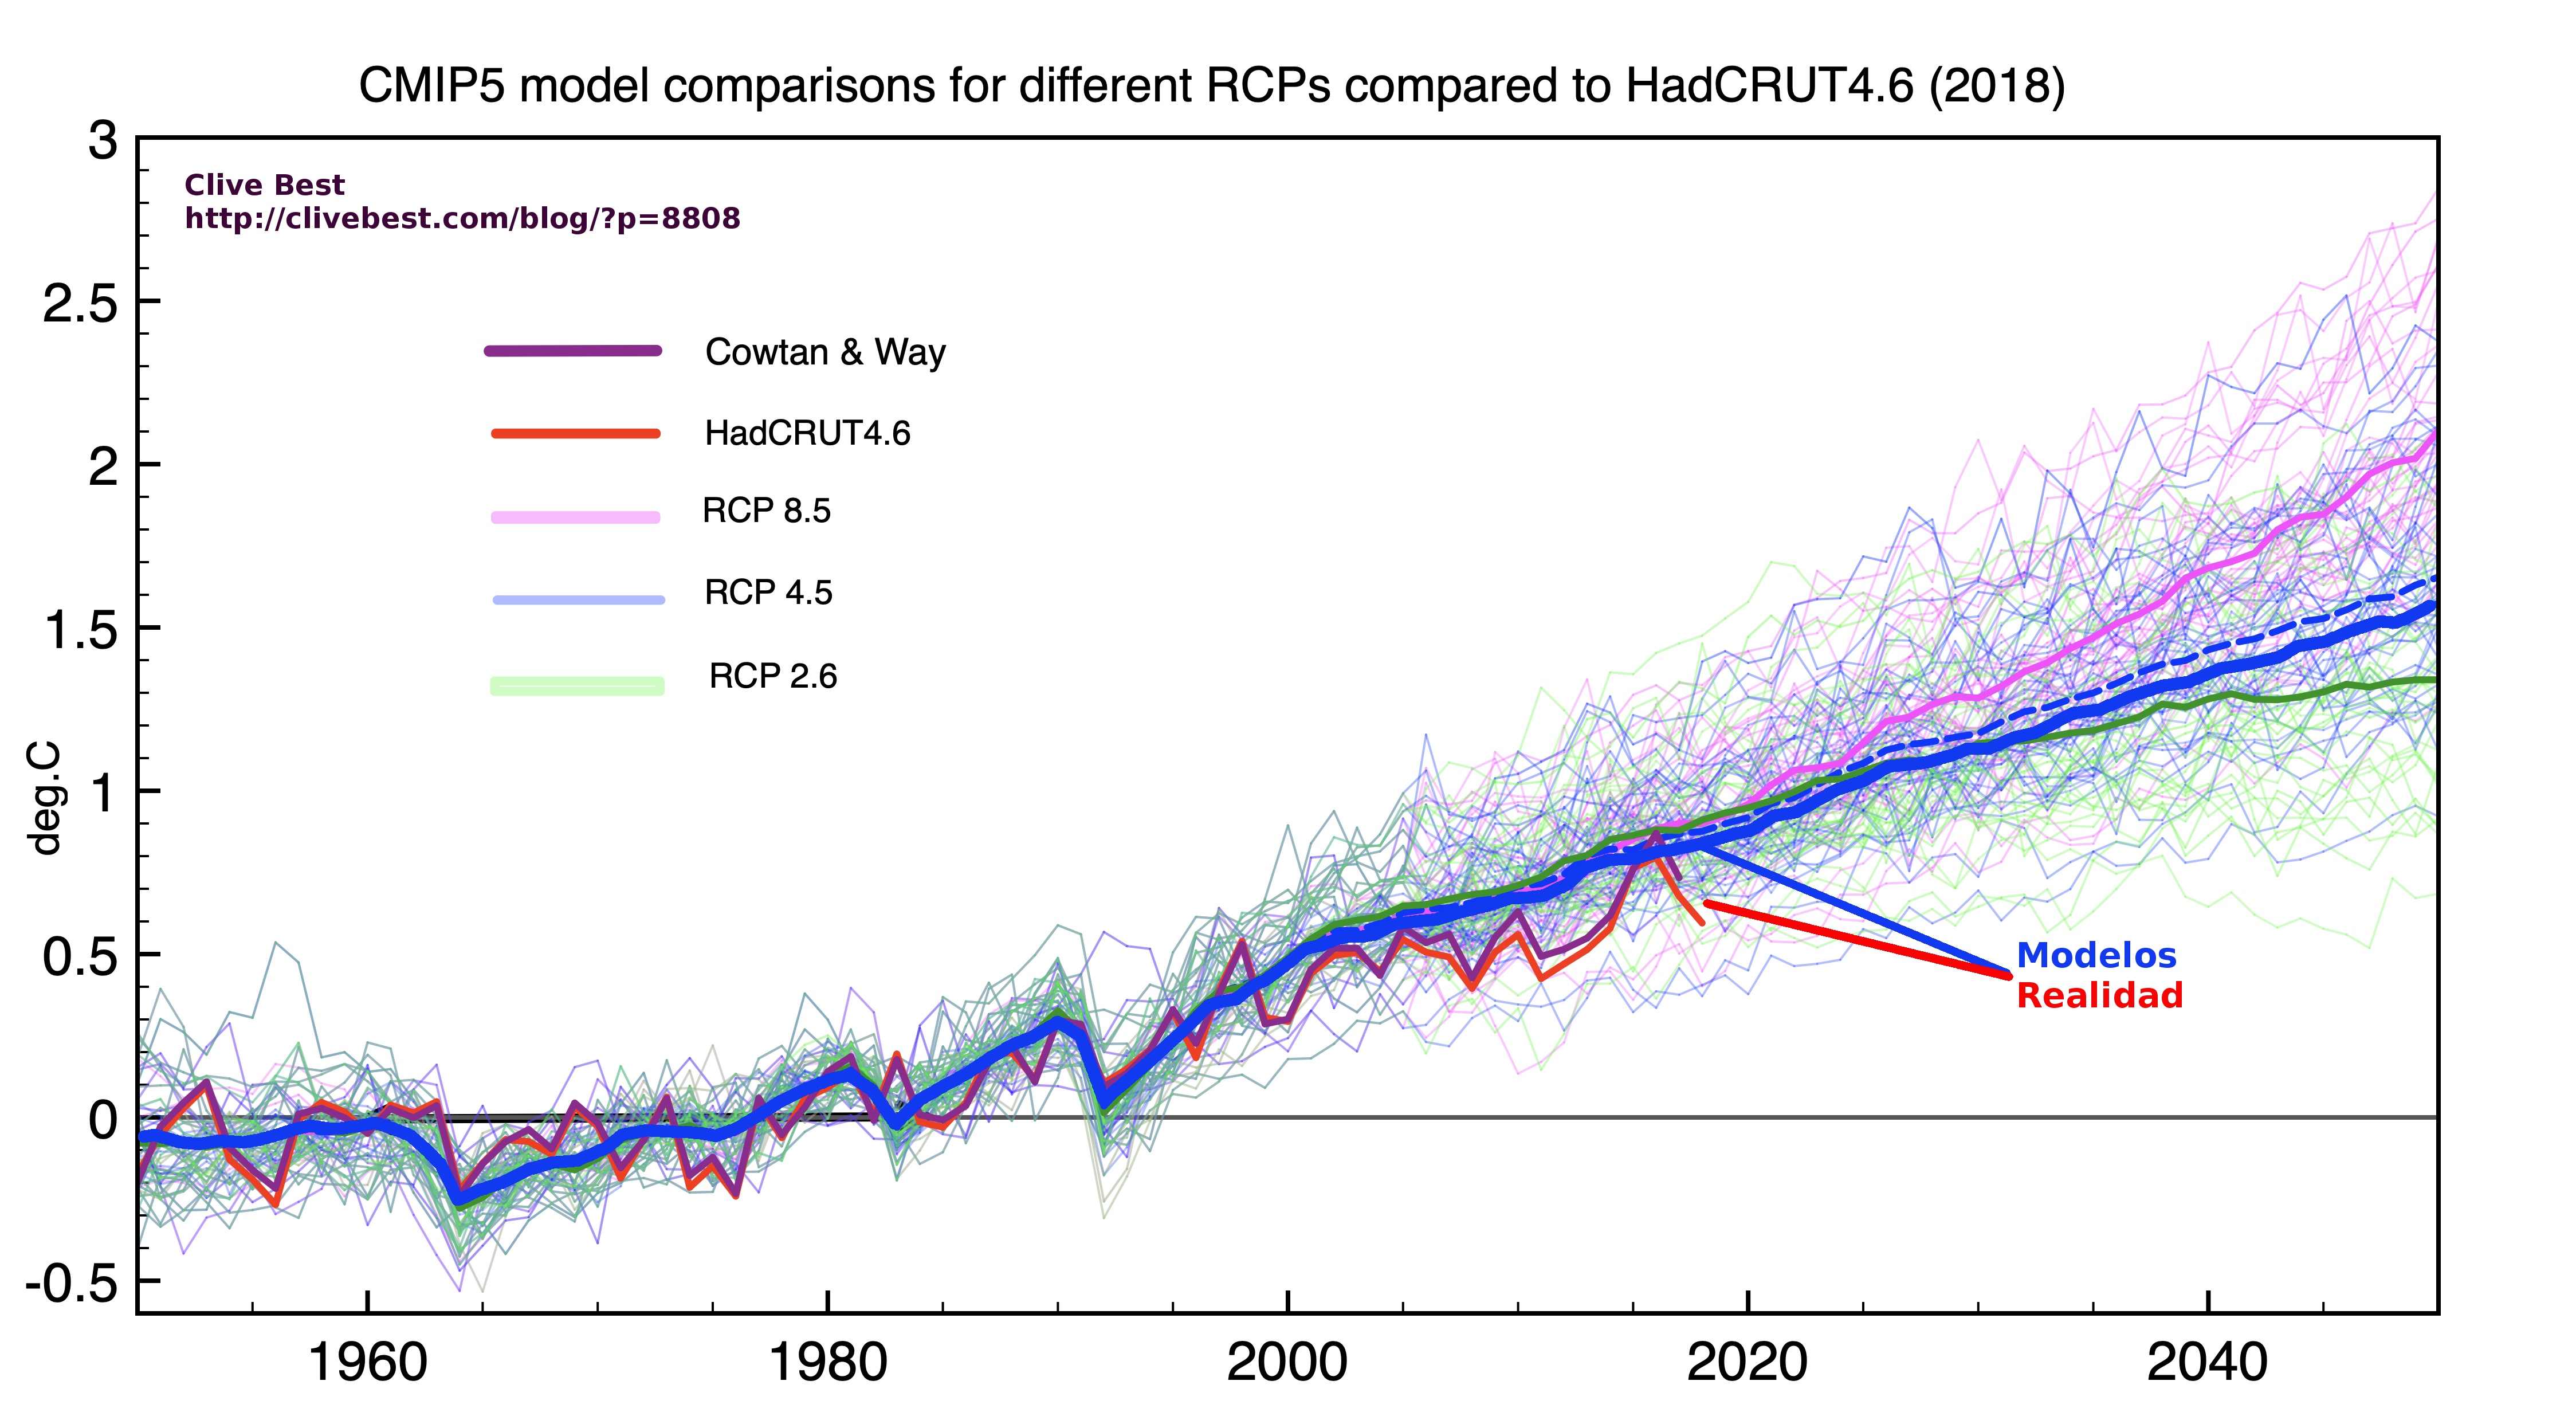
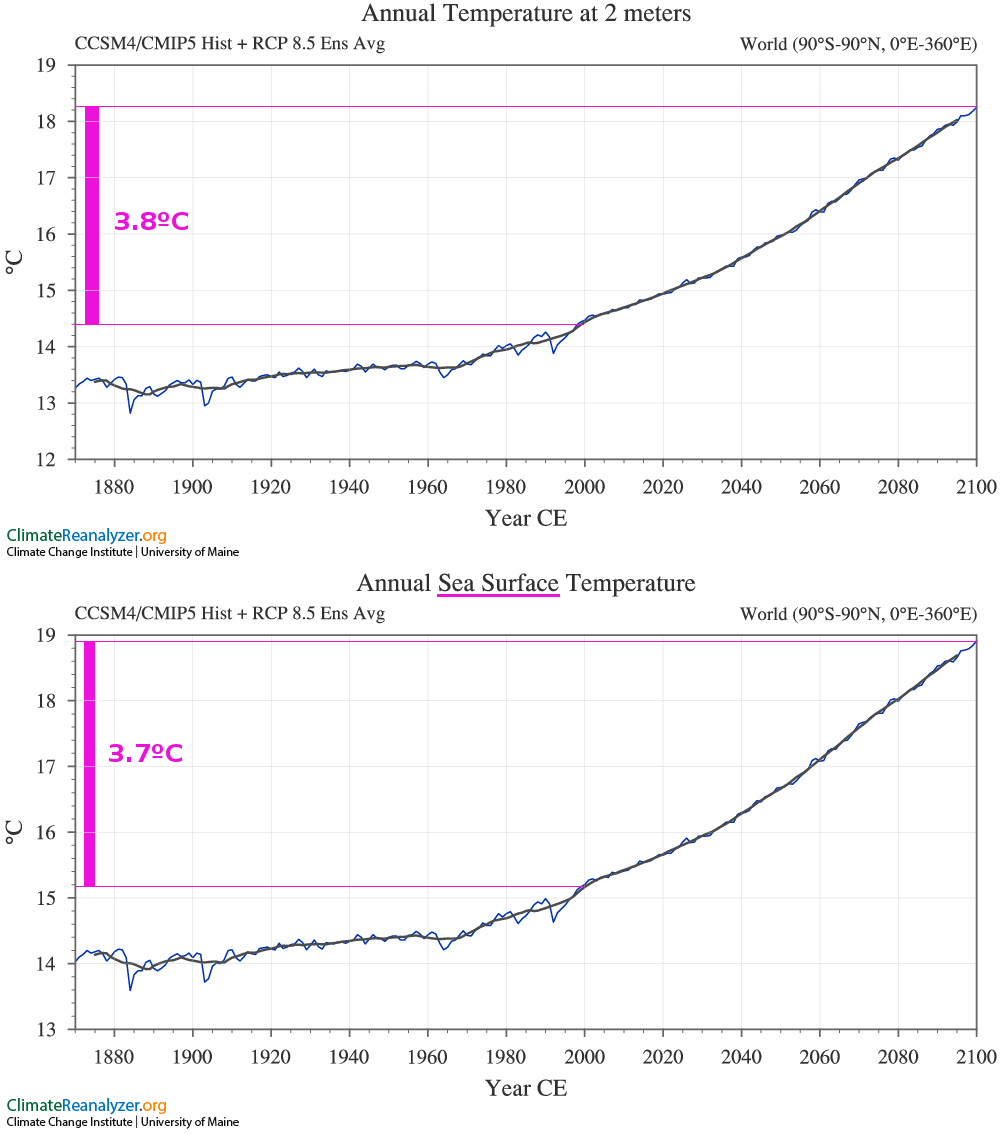
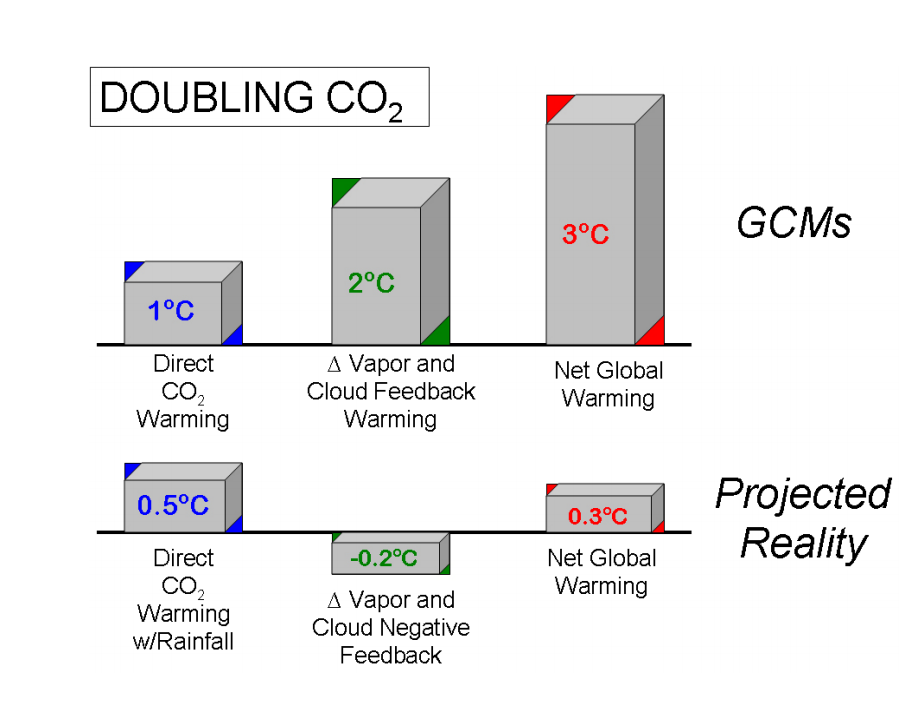
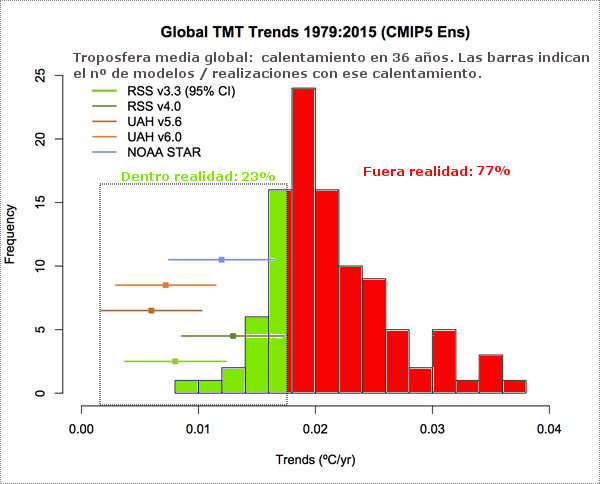
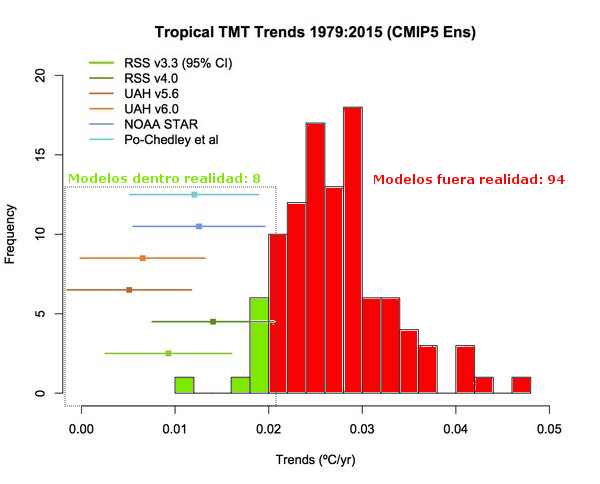
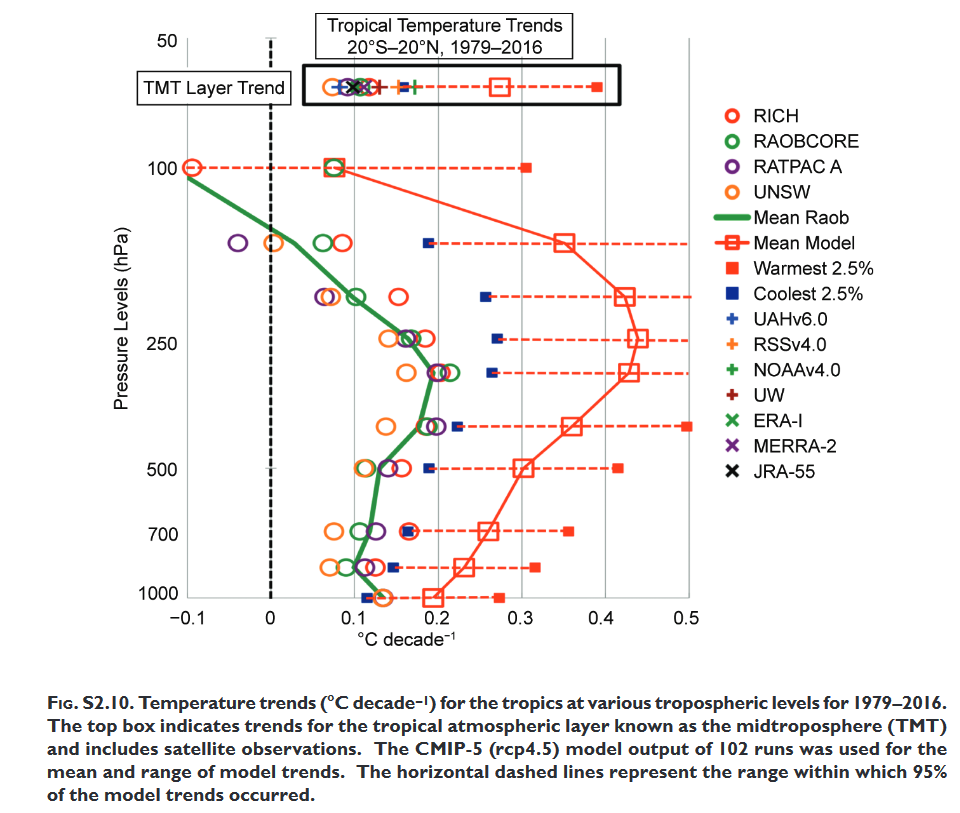
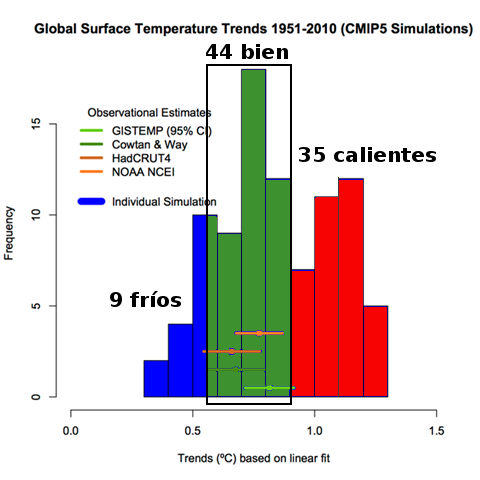
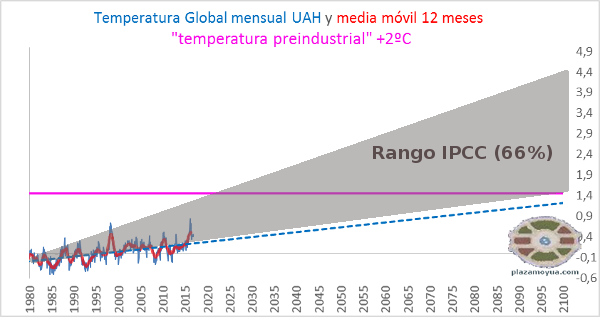
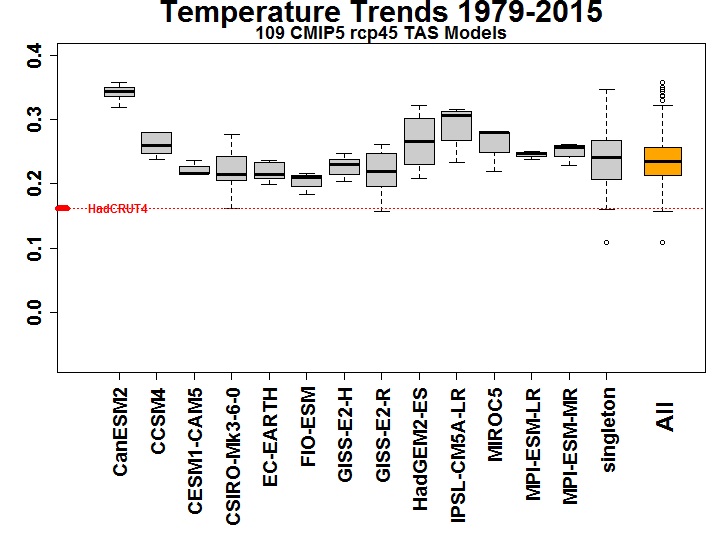
Modelos climáticos / realidad.
Satélites, baja troposfera:
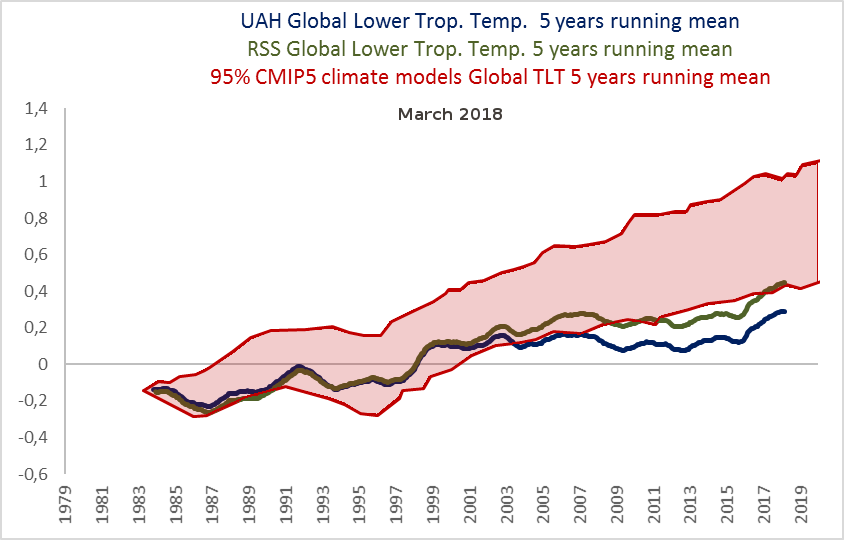
Superficie Cowtan - Way / HadCrut4, desde Clive Best. Clic para ampliar.
Cita:
“Principles governing IPCC workCita:The role of the IPCC is to assess on a comprehensive, objective, open and transparent basis the scientific, technical and socio-economic information relevant to understanding the scientific basis of risk of human-induced climate change, its potential impacts and options for adaptation and mitigation.” https://www.ipcc.ch/pdf/ipcc-principles/ipcc-principles.pdf

Cita:
Datos (versión 2016)
–
La evidencia
De nuevo la imaginaria “evidencia” del cuento del Calentamiento Global Acojonante
Esta es muy buena, porque es completa. Artículo en el New York Times, de periodista “enterado” pero asesorado por Raymond Pierrehumbert, uno de los más renombrados pilares de la teoría alarmista.
--
¿Es razonable pensar que provocamos “calentamiento global” con el CO2? ¿Y que sea un problema?
–
Modelos climáticos y p*** realidad; ¿se entienden los gráficos?
Gavin Schmidt intenta justificar los modelos:Troposfera media global:
Troposfera media tropical:
 Superficie:
–
Bates 2016
Más: Más (Krastov) En WUWT: Más:. Recently, attempts have been made to refine the EfCS approach by using two-zone (tropical/extratropical) EBMs. When applied using satellite radiation data, these give low and tightly constrained EfCS values, in the neighborhood of 1°C
Robert Brown sobre los modelos (a partir de la mitad)
Hansen: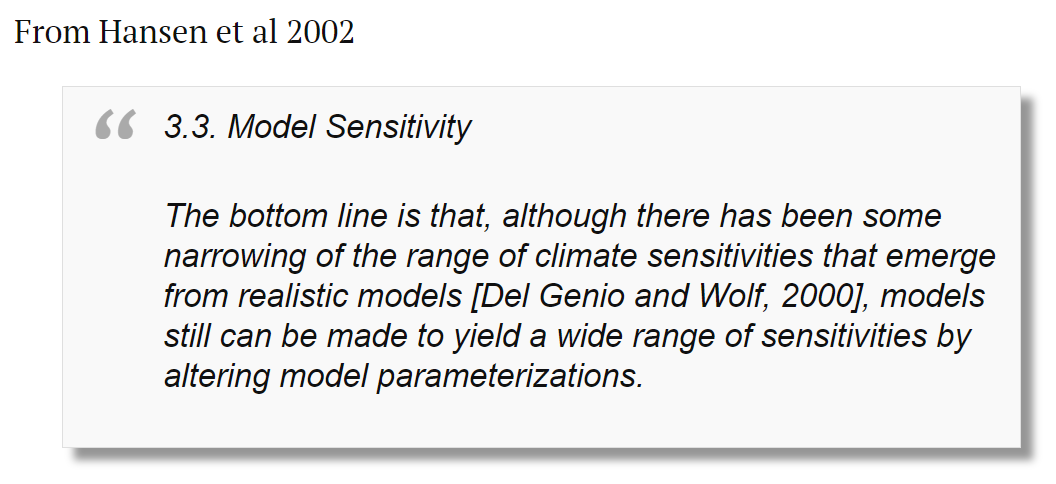
Laepple y Huybers 2014:
--Junio 2017: El efecto iris de Lindzen revisitado:
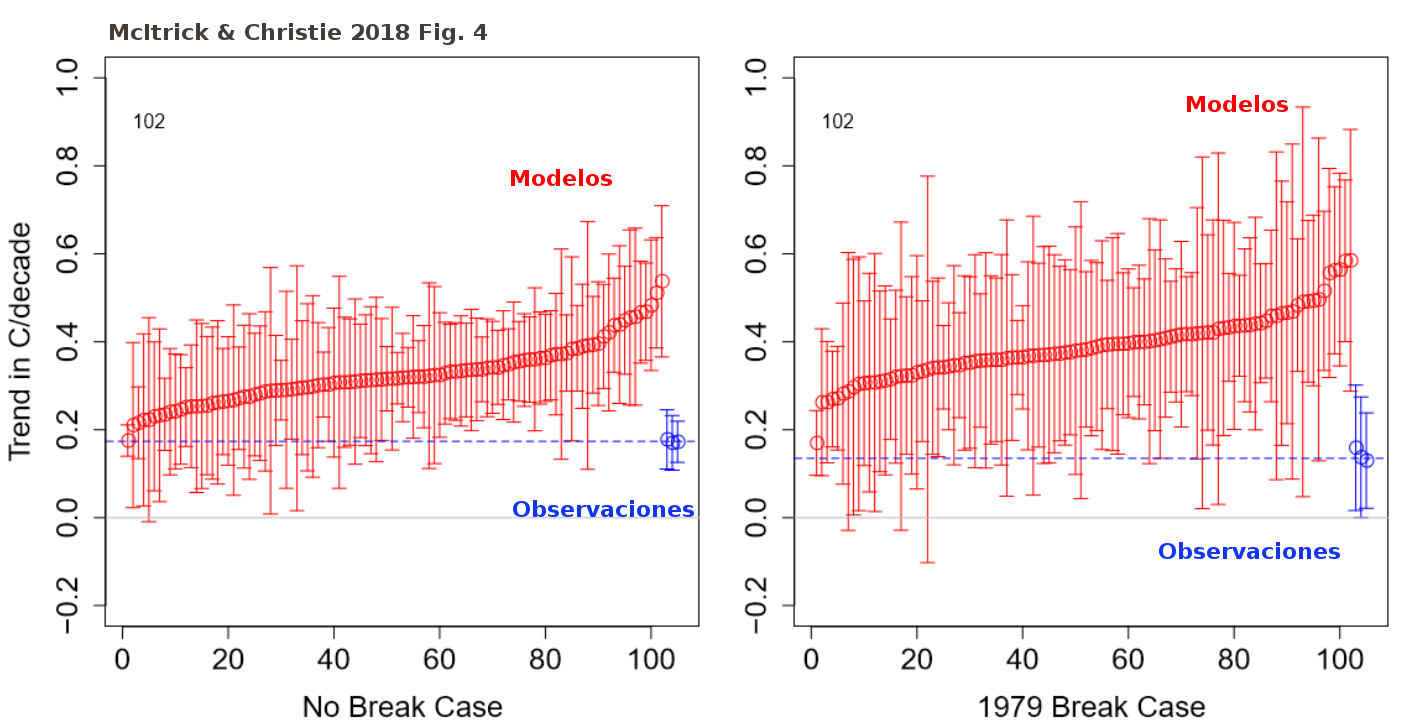
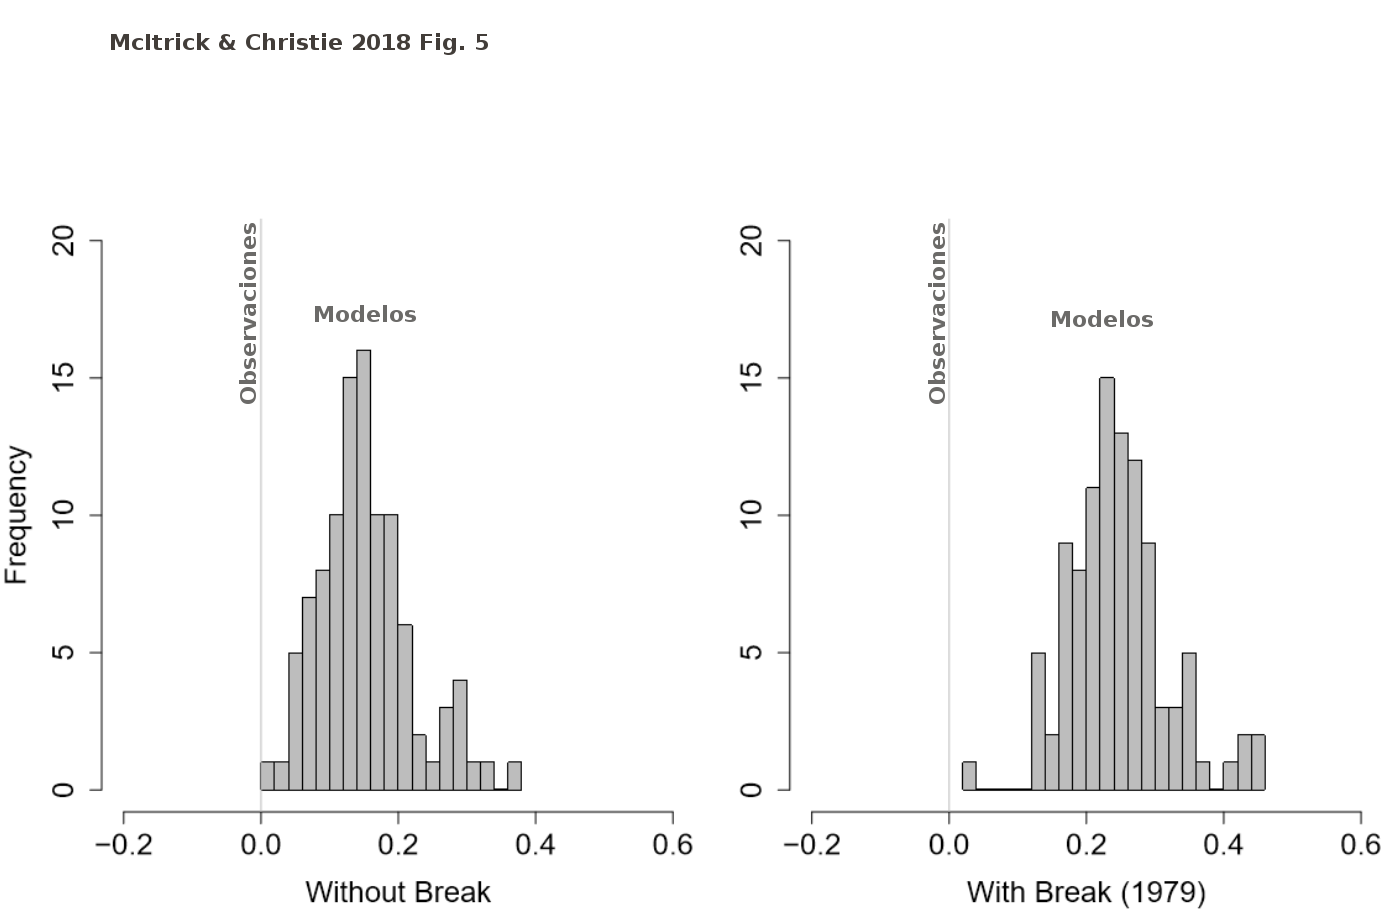
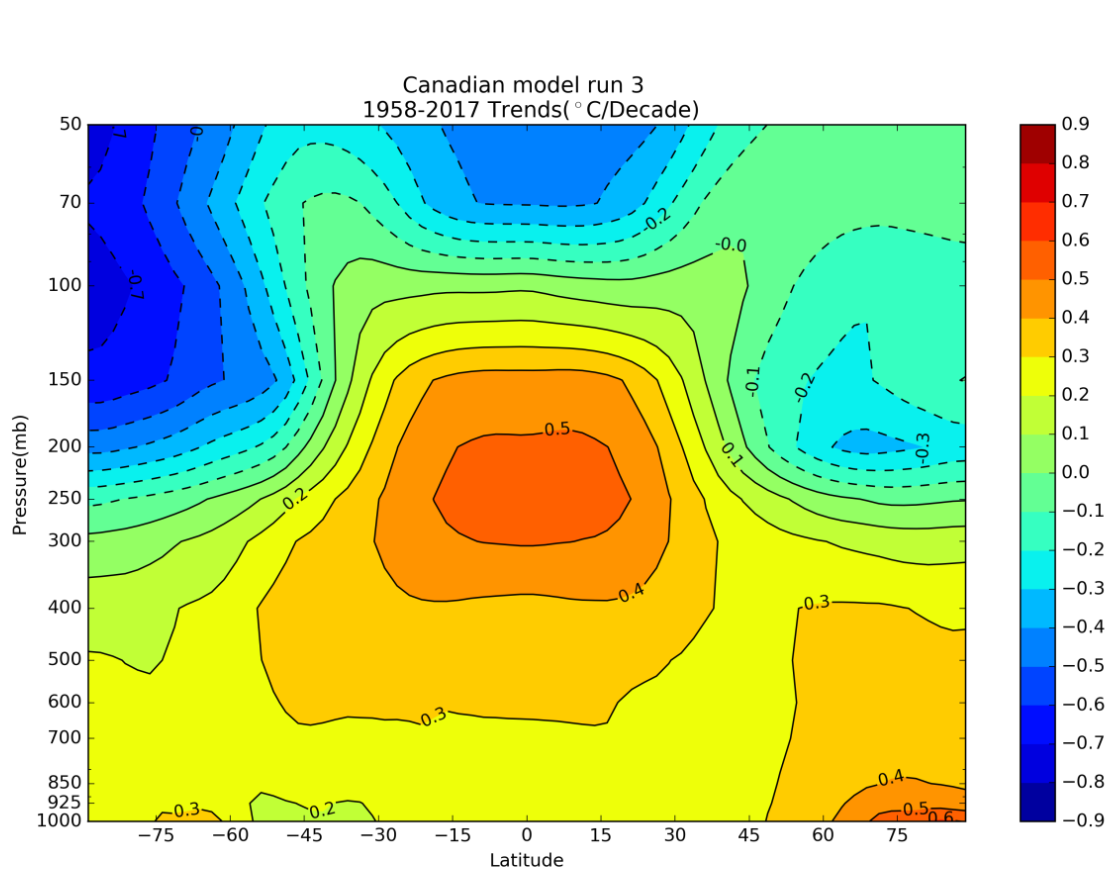
Tsonis y caos: Septiembre 2018, McItrick y Christie: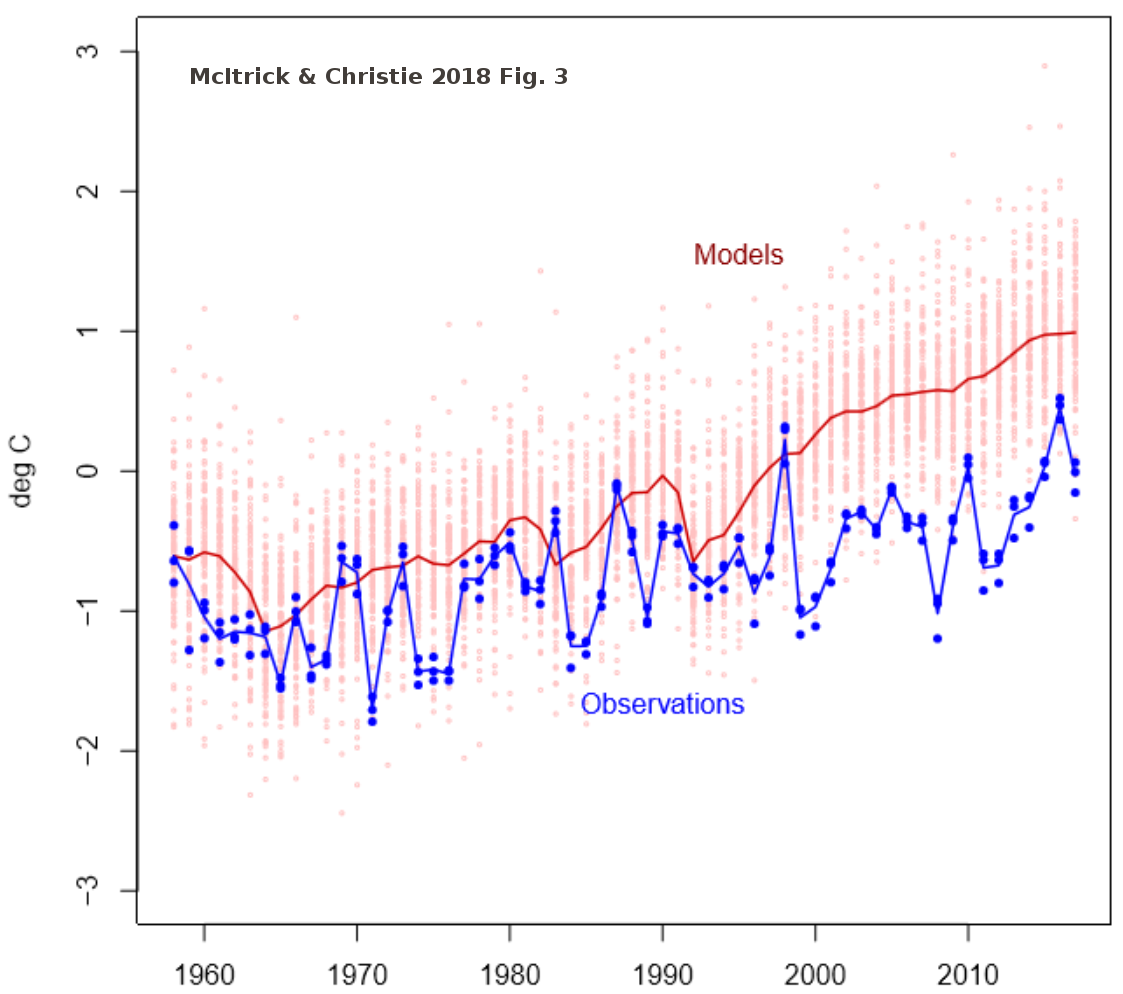

–
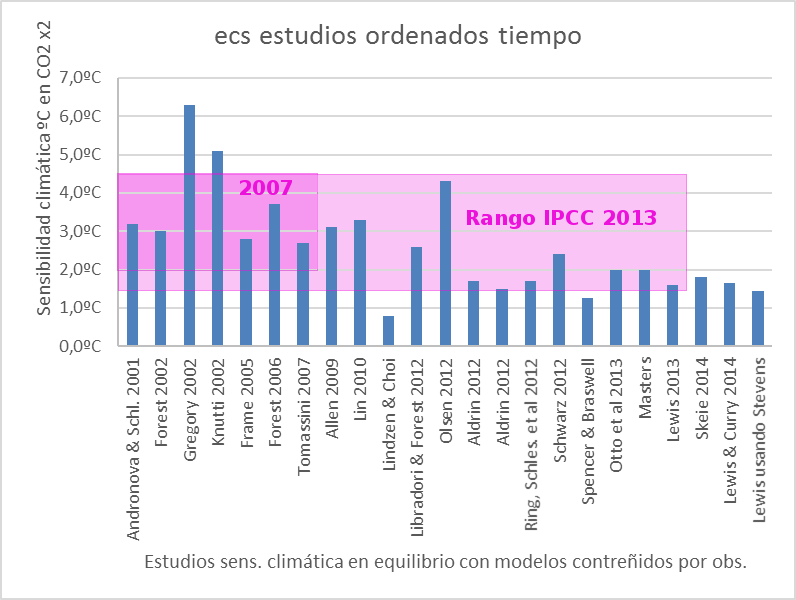
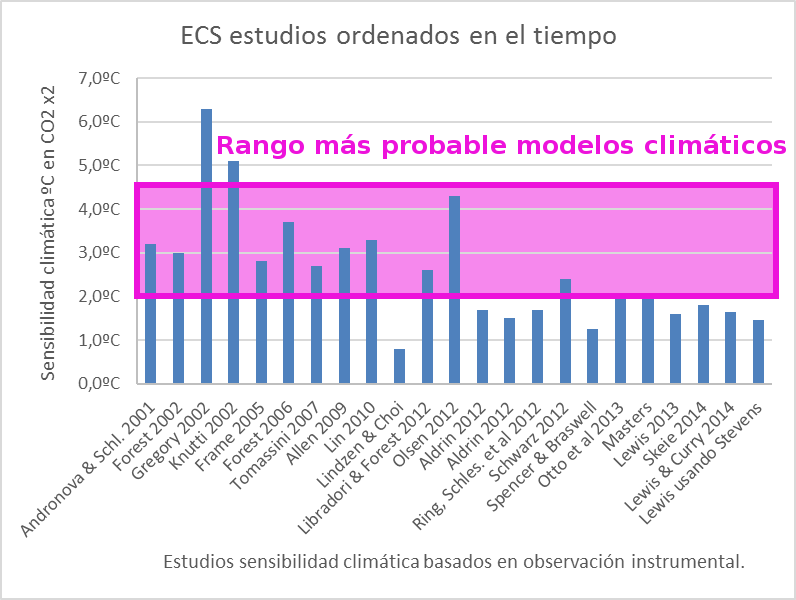
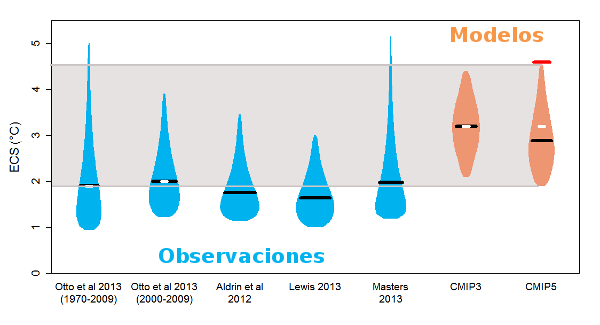
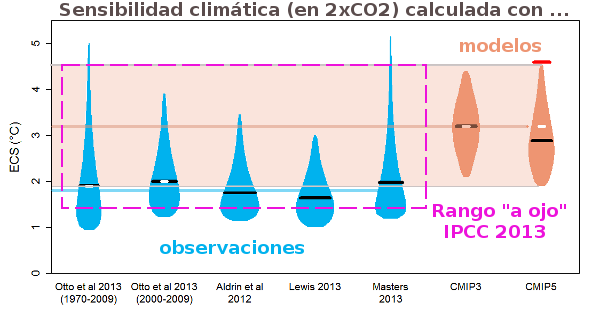
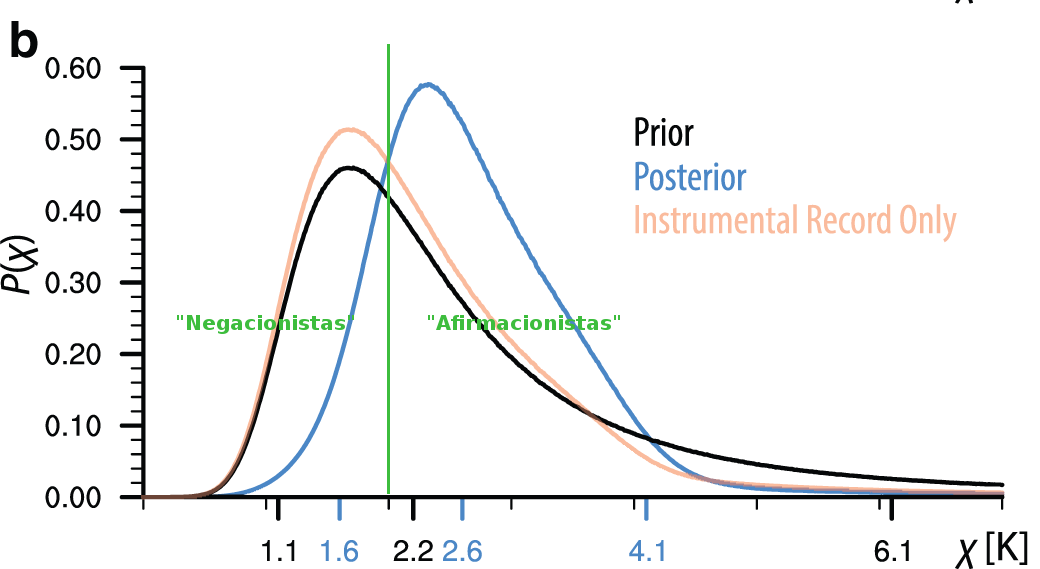
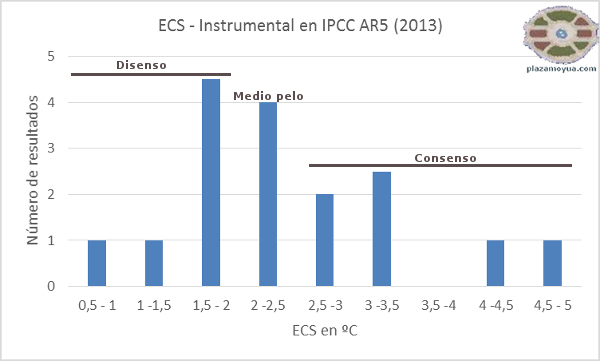
Estudios sobre sensibilidad climática ordenados en el tiempo.
Cambio por nuevas estimaciones frozamiento aerosoles (Stevens y Malavelle et al 2017):
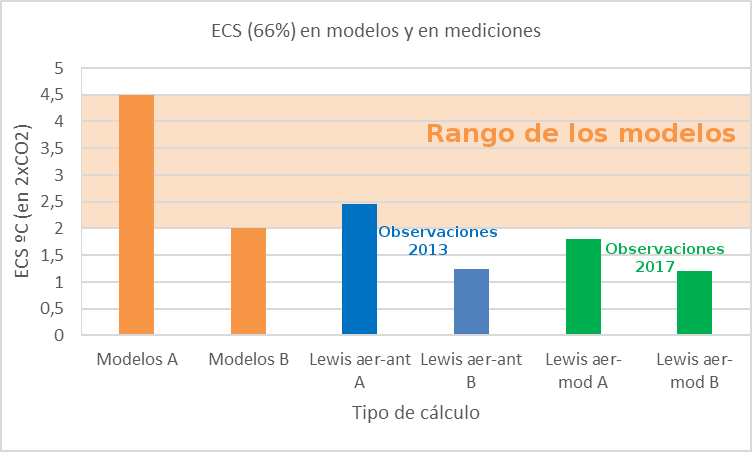
- http://www.staatvanhetklimaat.nl/2013/09/14/nic-lewis-response-will-hit-met-office-like-a-boomerang/
Modelos con y sin “maquillaje”:
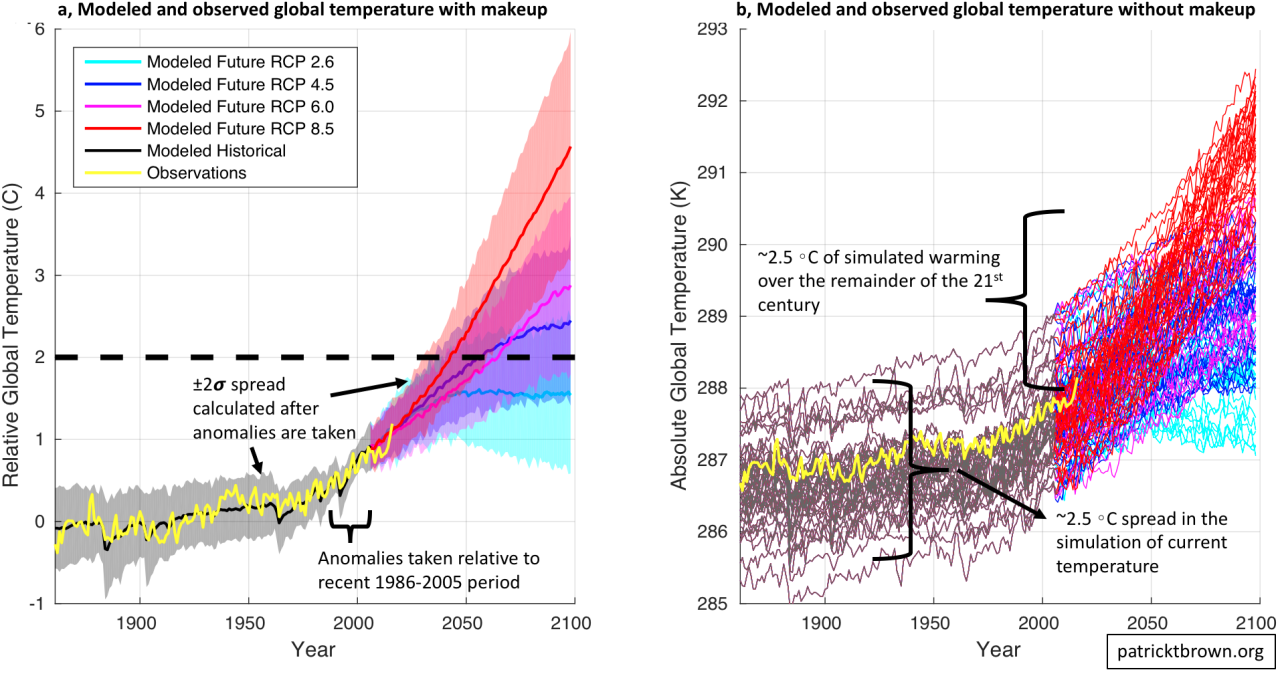
- https://patricktbrown.org/2017/07/10/modeled-vs-observed-global-temperature-with-and-without-makeup/
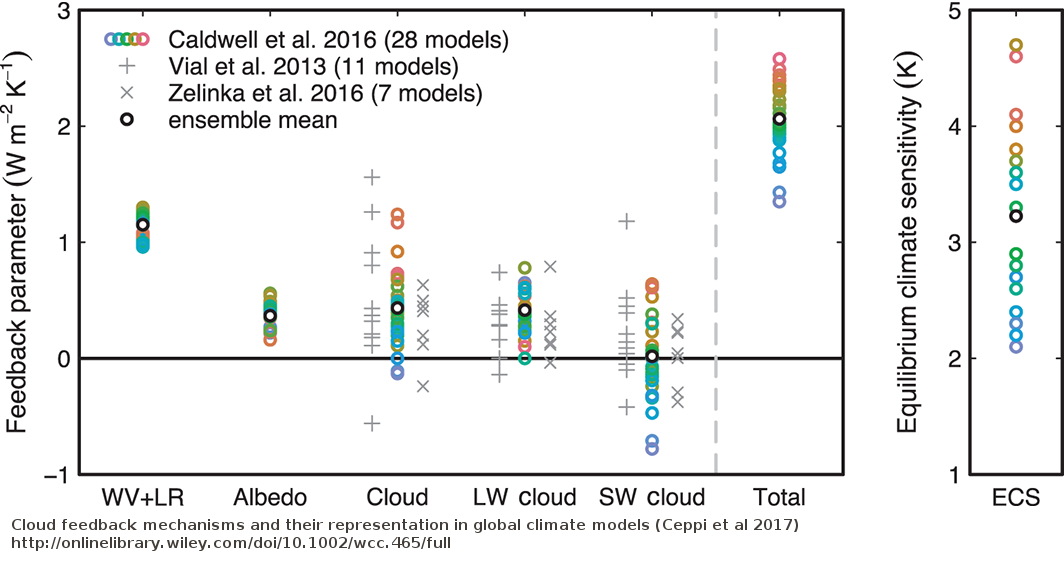
- http://onlinelibrary.wiley.com/doi/10.1002/wcc.465/full
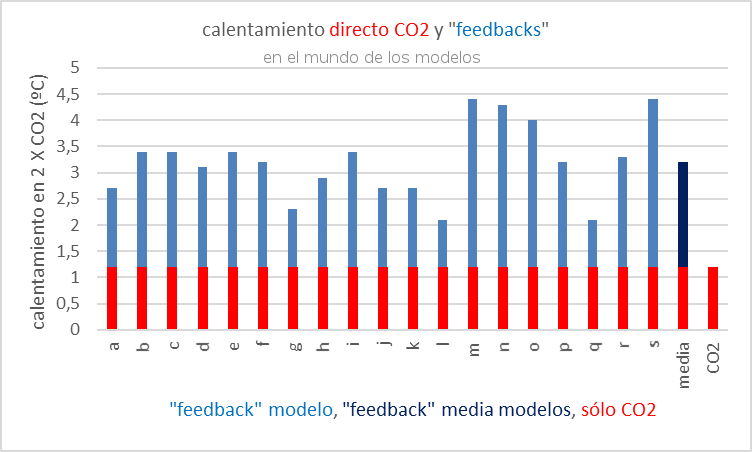
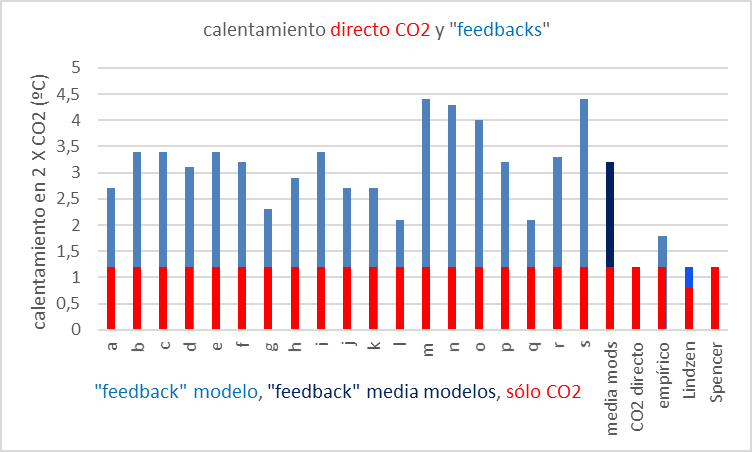
Using feedback parameters from Figure 8.14, it can be estimated that in the presence of water vapour, lapse rate and surface albedo feedbacks, but in the absence of cloud feedbacks, current GCMs would predict a climate sensitivity (±1 standard deviation) of roughly 1.9°C ± 0.15°C (ignoring spread from radiative forcing differences). The mean and standard deviation of climate sensitivity estimates derived from current GCMs are larger (3.2°C ± 0.7°C) essentially because the GCMs all predict a positive cloud feedback (Figure 8.14) but strongly disagree on its magnitude.
–
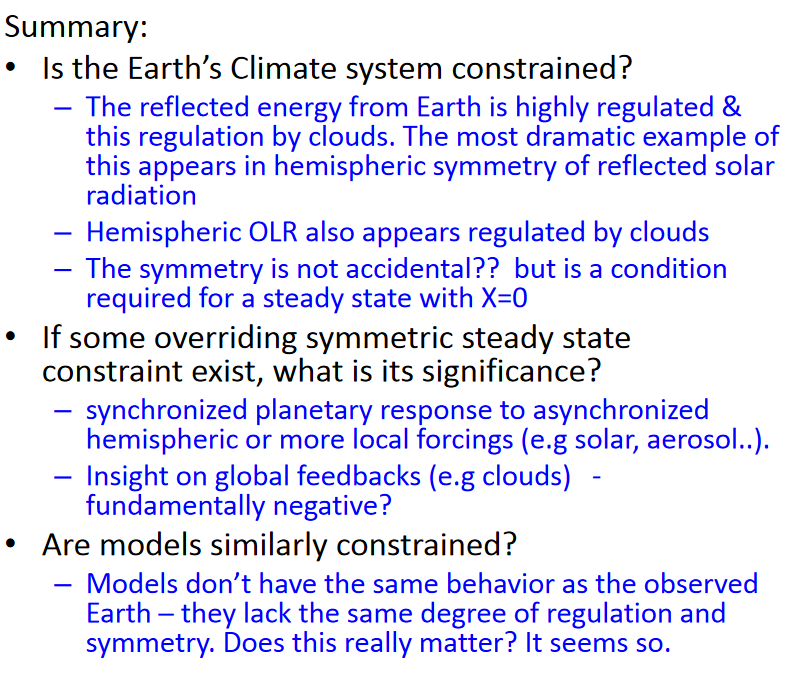
Graeme Stephens, O’Brien, Webster, Pilewskie, Kato, Li:
–
Comentado en:
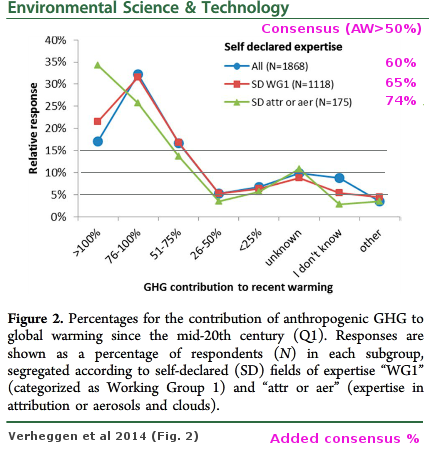
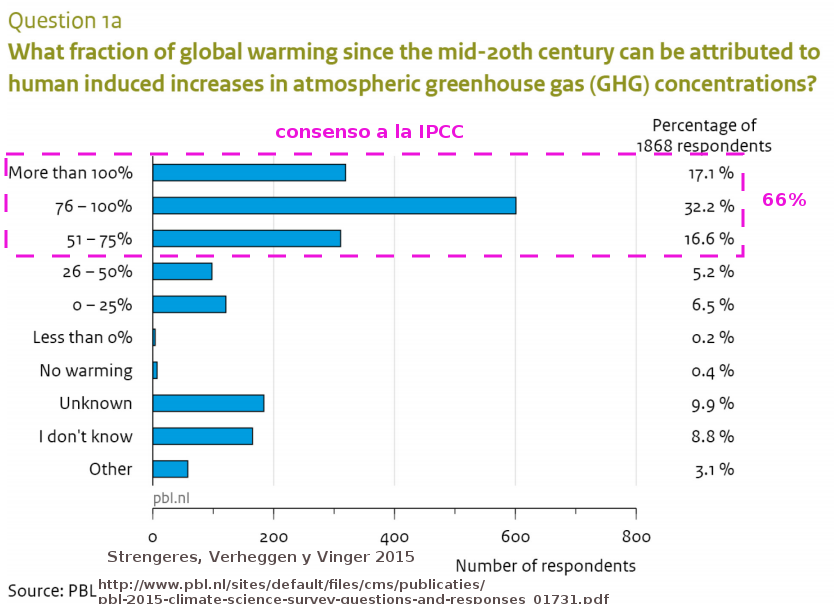
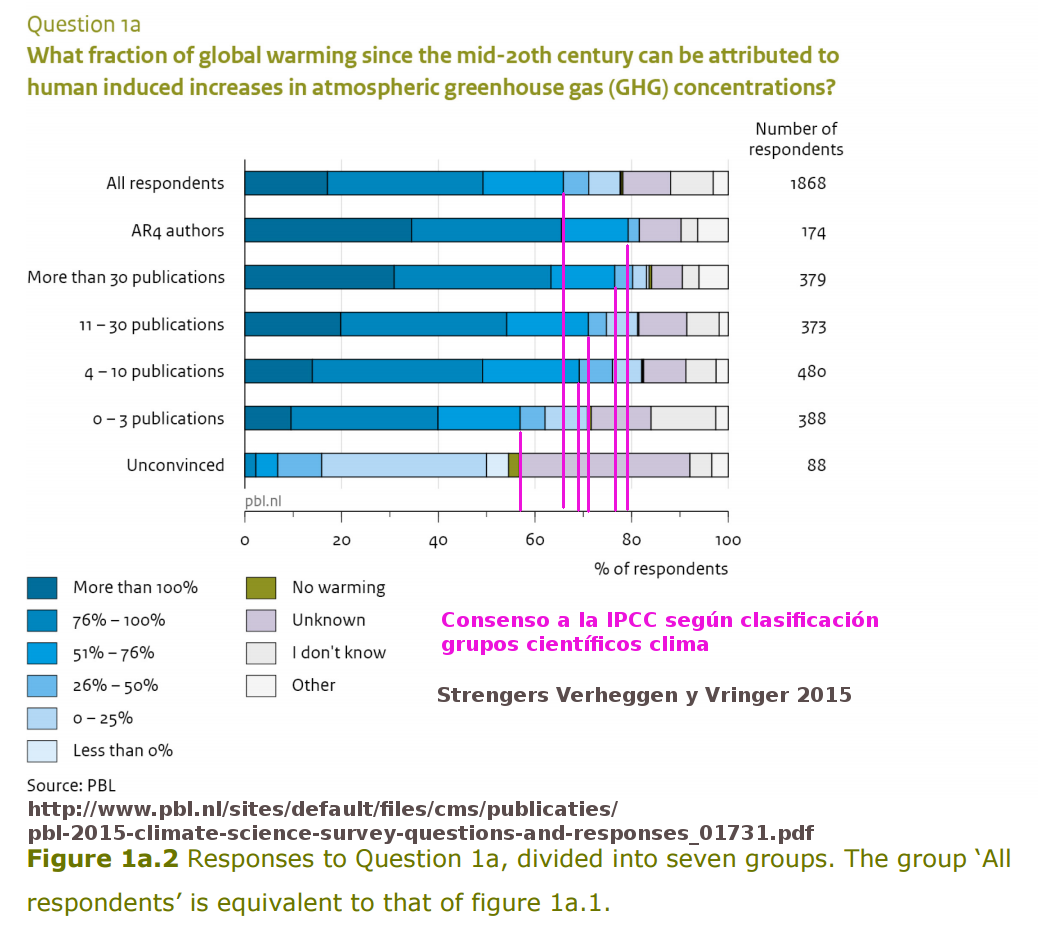
El consenso, por fin, pensando en modo ciencia (y ahora empieza la discusión)
--Consenso (Verheggen):
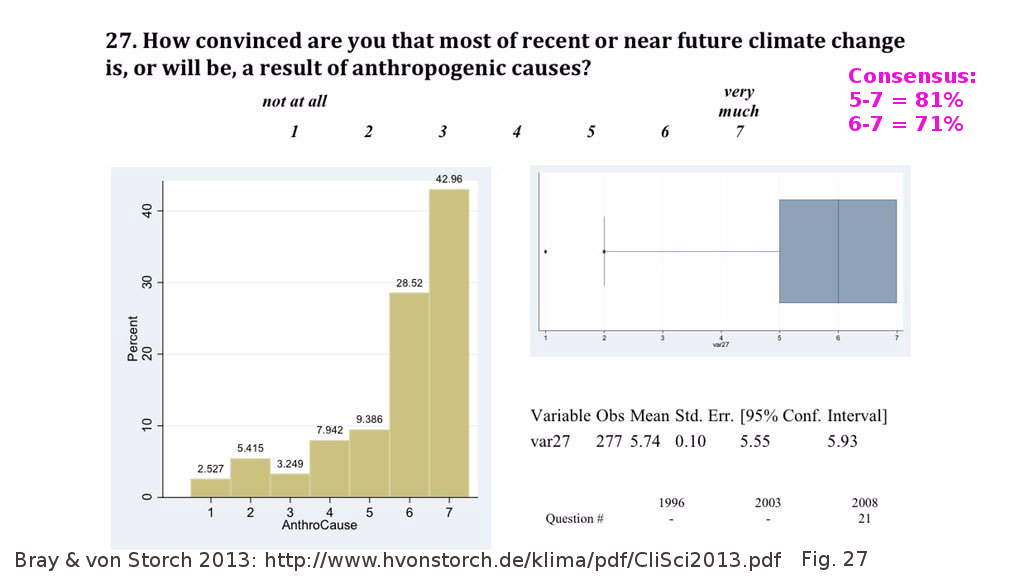
Consenso Bray & von Storch 2013
José Duarte:
Muy relacionado: Lorenz sobre el problema del caos y la “atribución”, extractos de Judith Curry:
--Beneficios bien observados y medidos del Calentamiento Global Acojonante:
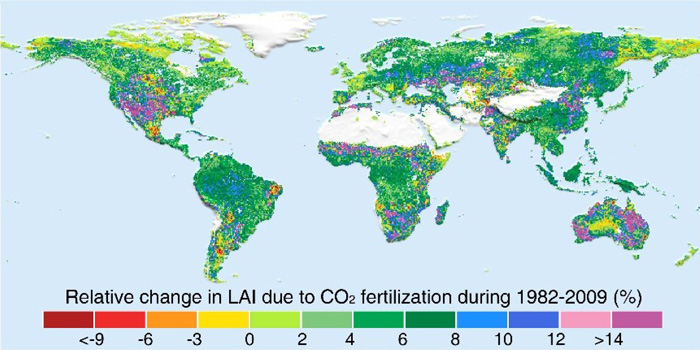
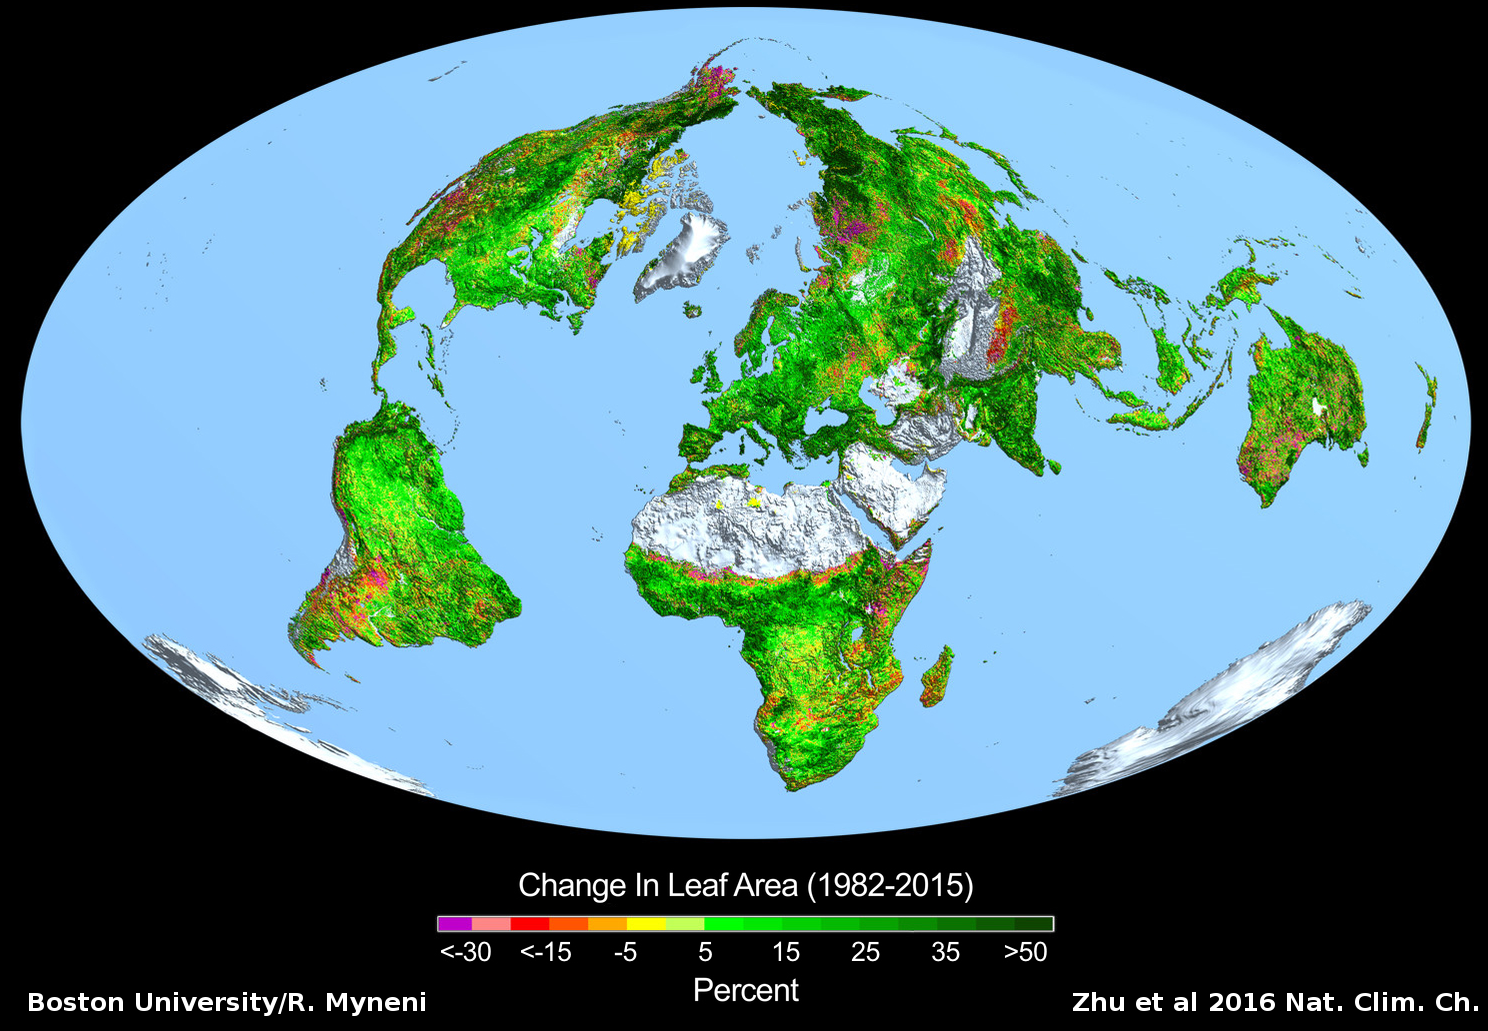
Reverdecimiento:
El reverdecimiento del planeta y sus causas (el 70% es por el CO2)

–
Li et al 2017:
--En el Sahel, lluvia. Mediciones locales:
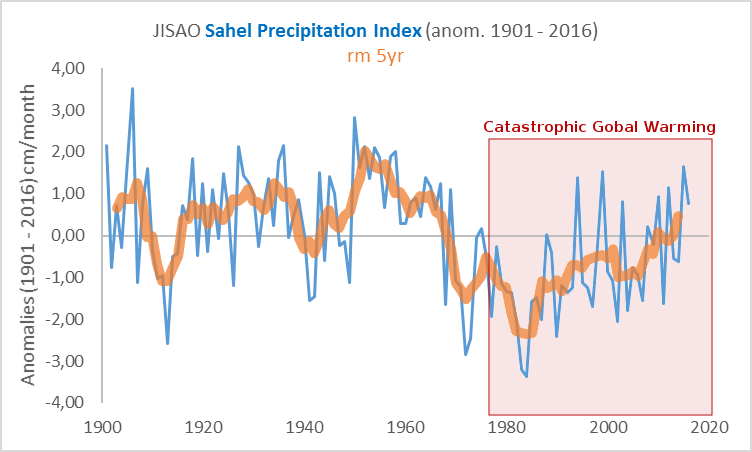
- http://research.jisao.washington.edu/data_sets/sahel/ (doi:10.6069/H5MW2F2Q)
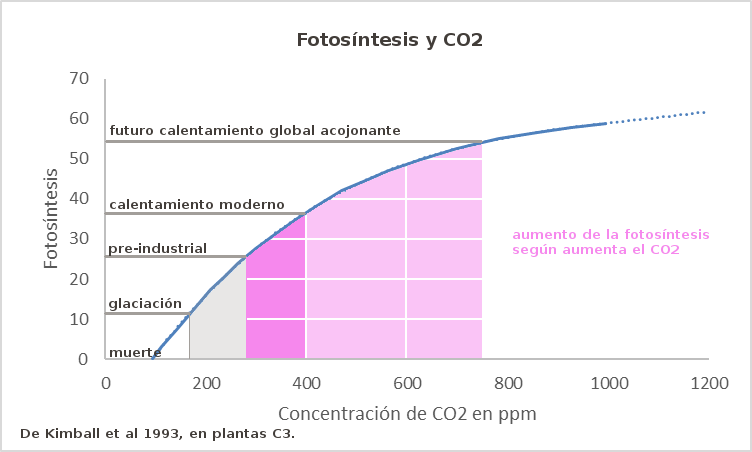
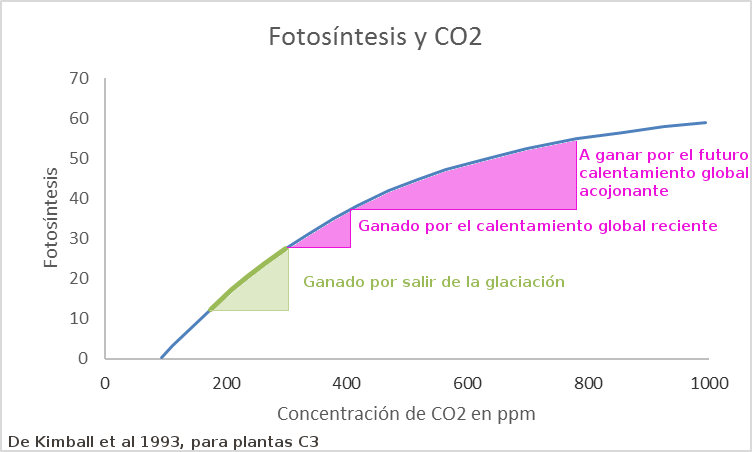
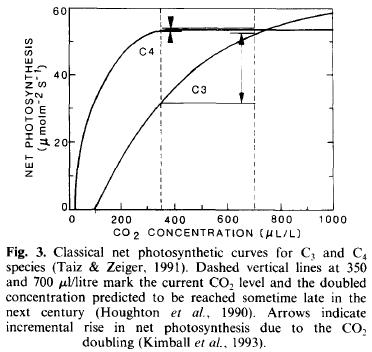
Y la eficiencia en el uso del agua (C3 -maiz- y C4 -soja-)
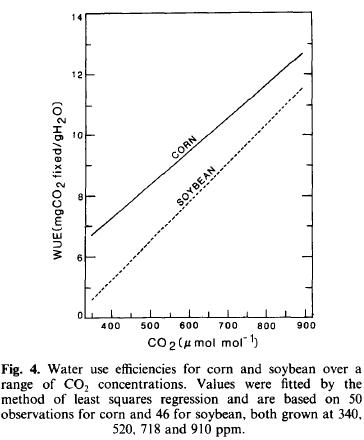
- https://buythetruth.wordpress.com/2009/06/13/photosynthesis-and-co2-enrichment/
La inexistente relación entre los huracanes y el calentamiento global
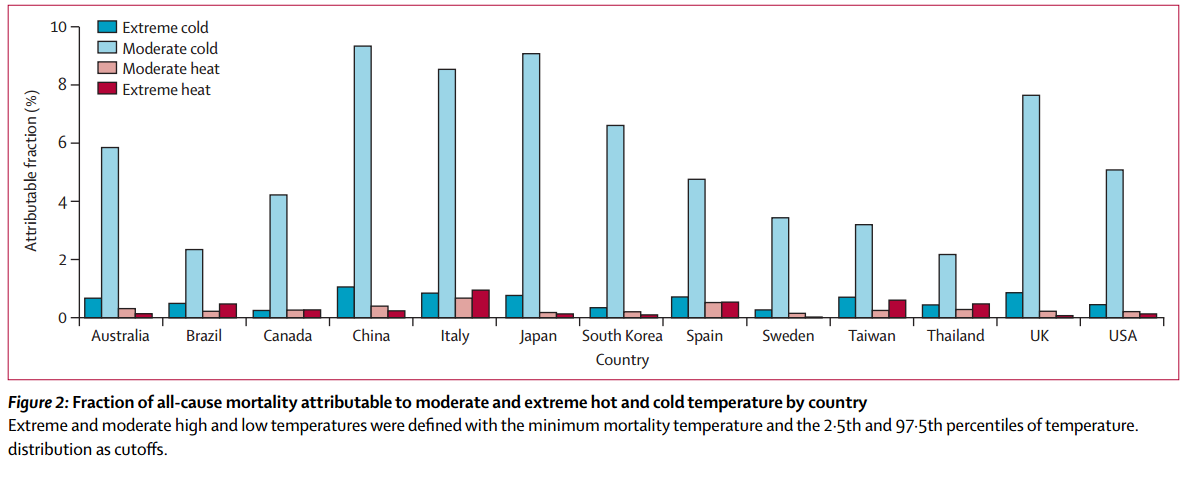
Recopilación en Fabius Maximus: --Menos muertes debidas a la temperatura
All regions showed more annual cold related mortality than heat related mortality. Some of those who died in the heat may not have lived long if a heat wave had not occurred. Mortality often falls below baseline for several days after the end of a heat wave, and this has been interpreted as indicating that some of the people dying during the heat wave were already close to death. Some of the excess deaths in the cold may have resulted from non-thermal seasonal factors such as winter diet, but deaths due to such factors are likely to be few. Falls in temperature in winter are closely followed by increased mortality, with characteristic time courses for different causes of death. The increases are of sufficient size to account for the overall increase in mortality in winter, suggesting that most excess winter deaths are due to relatively direct effects of cold on the population.
Our data suggest that any increases in mortality due to increased temperatures would be outweighed by much larger short term declines in cold related mortalities.
- Temperature and Mortality in 11 Cities of the Eastern United States
- Mortality risk attributable to high and low ambient temperature: a multicountry observational study

–
Varios:
¿Qué diablos negamos los "negacionistas"?
--Calentamiento Global para Imma
–
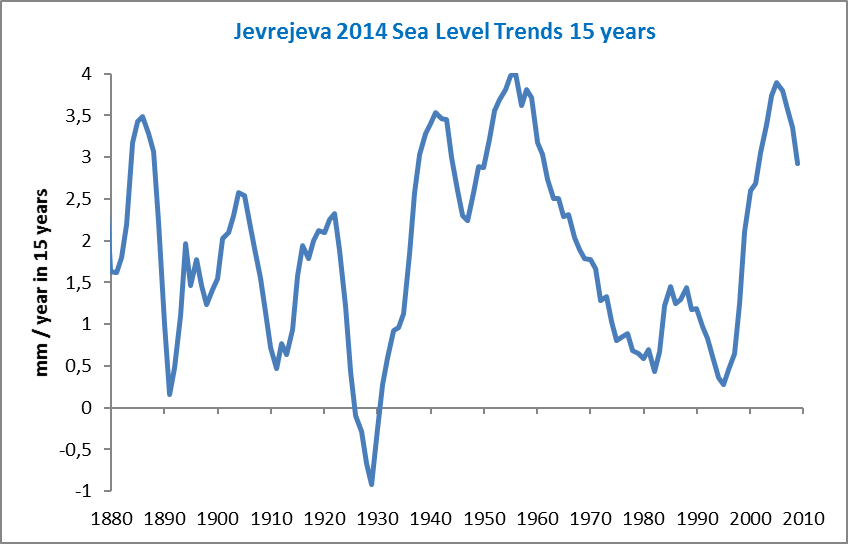
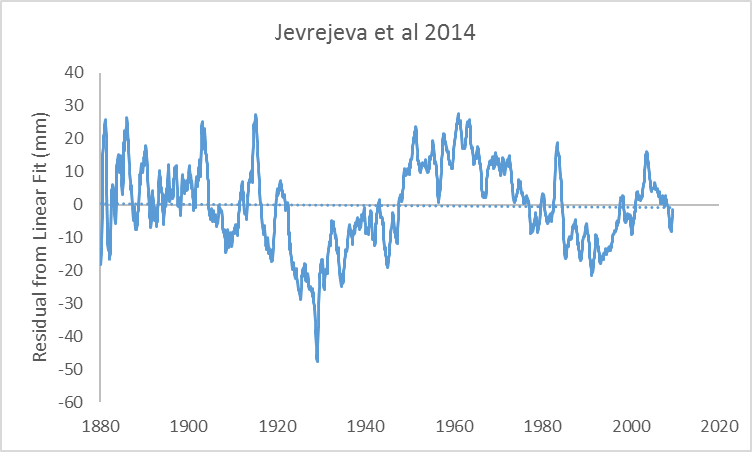
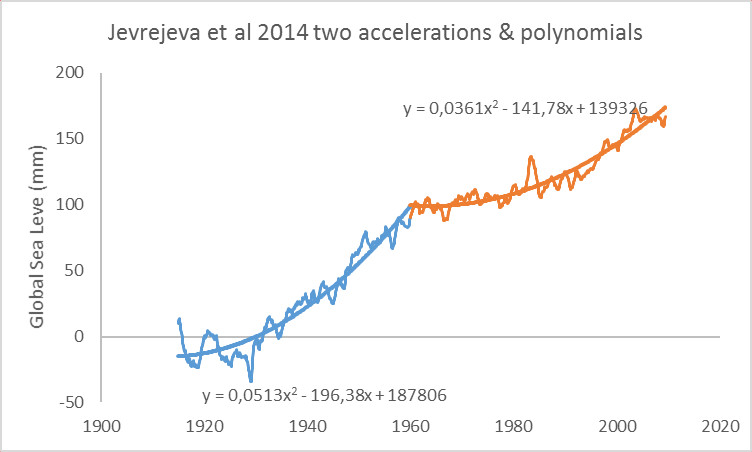
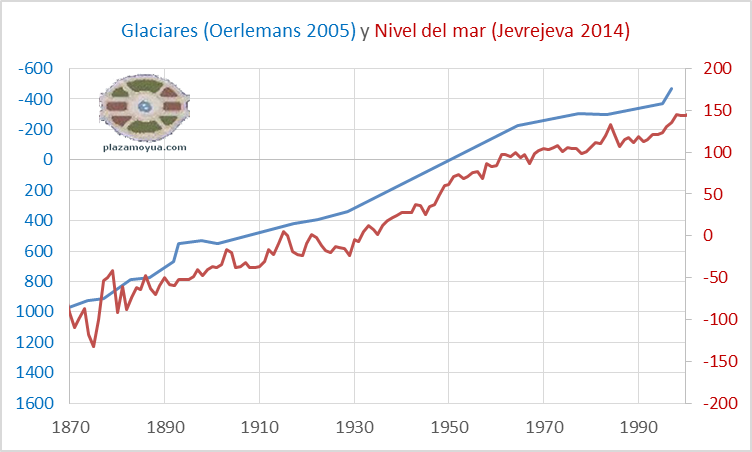
Nivel del mar:
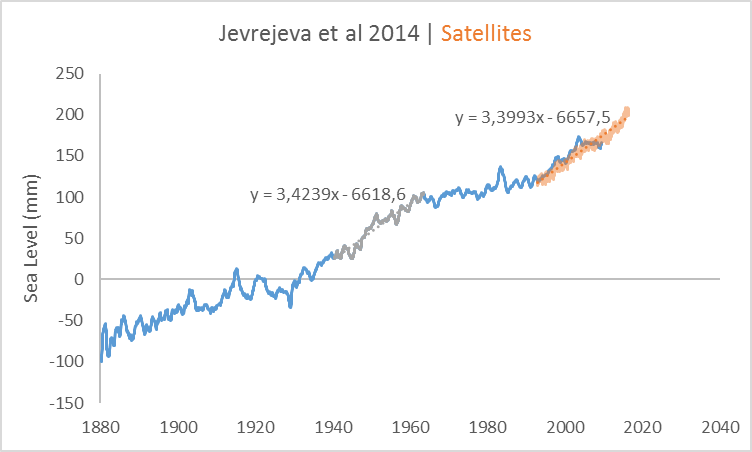
Nivel del mar. Último estudio, muy esperado, sin noticias del CO2. 19 cm / siglo, sin aceleración.
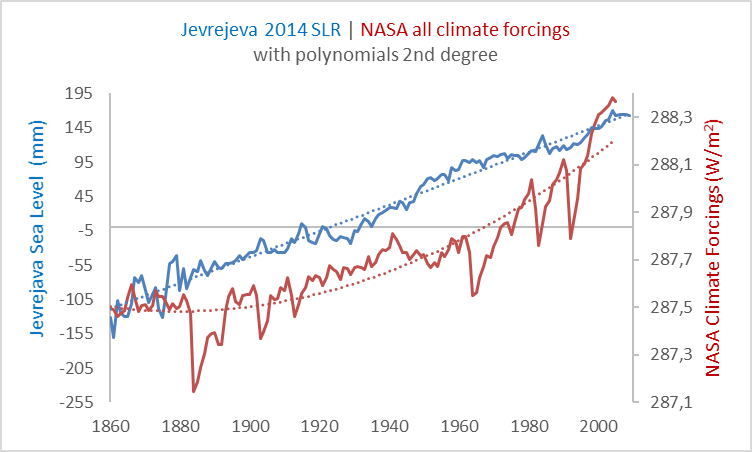
Jevrejeva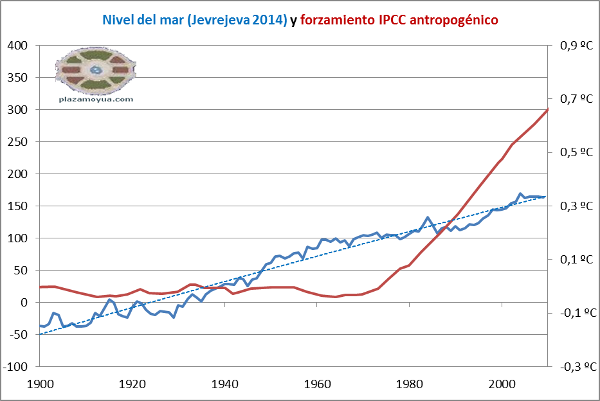
–
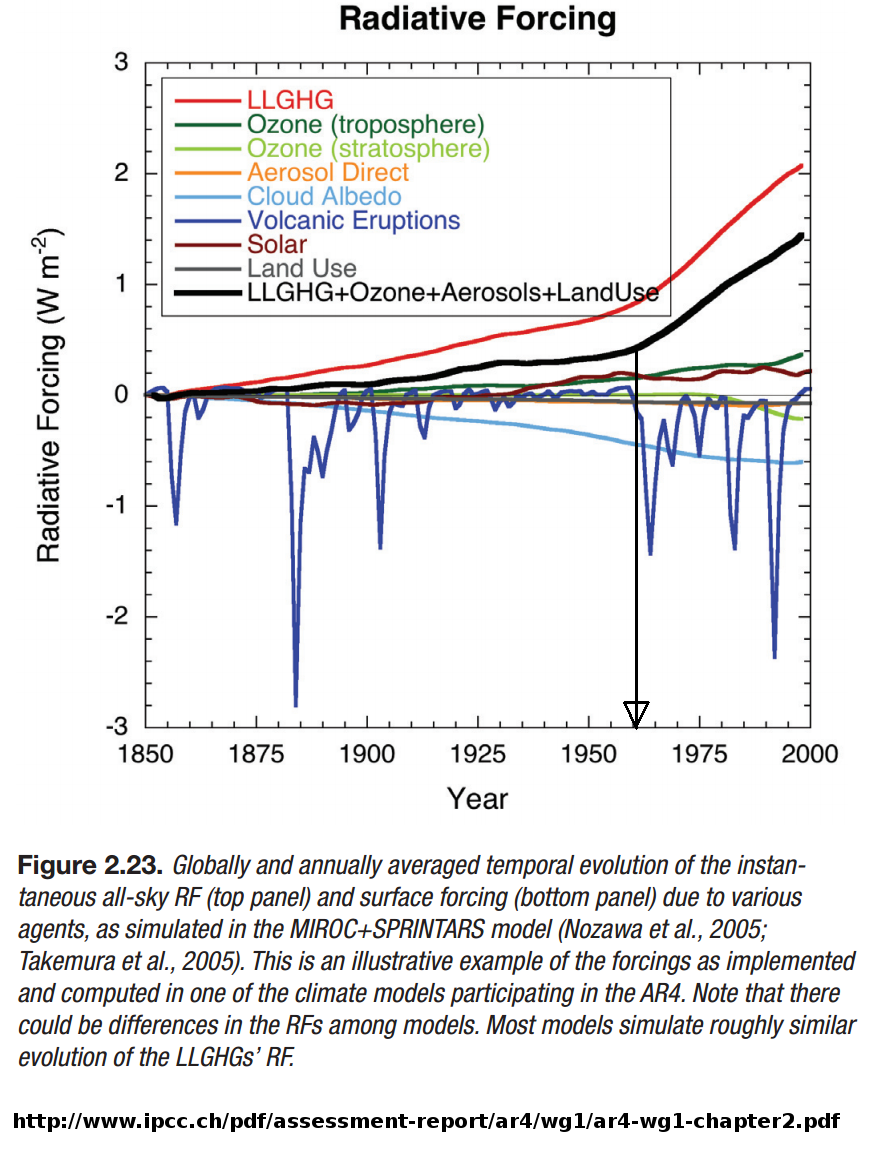
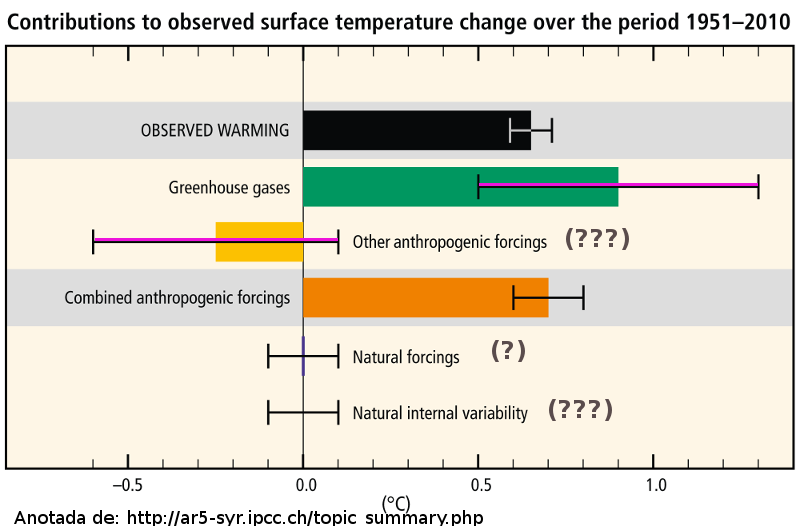
Y con todos los fozamientos que imaginan, en W/m2:
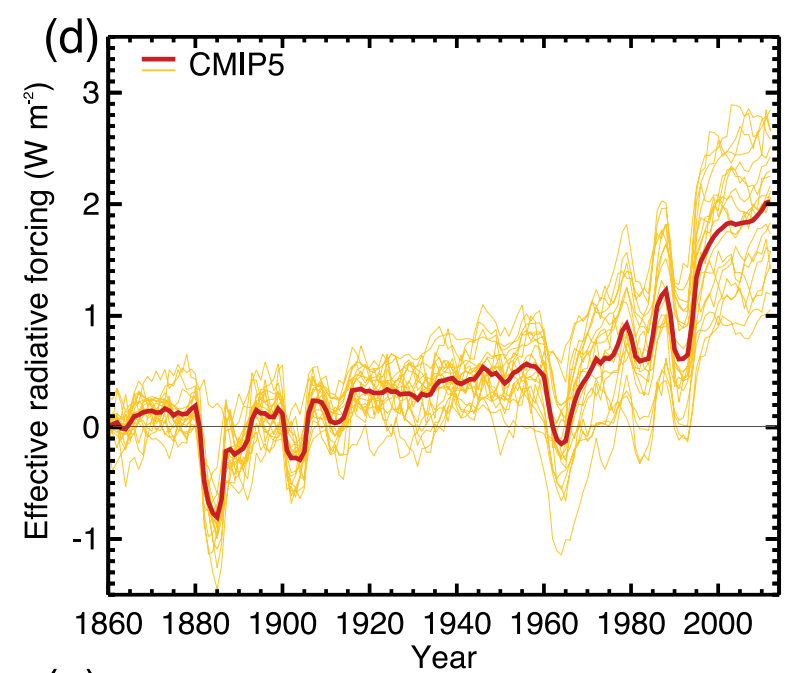
Descompuestos así:
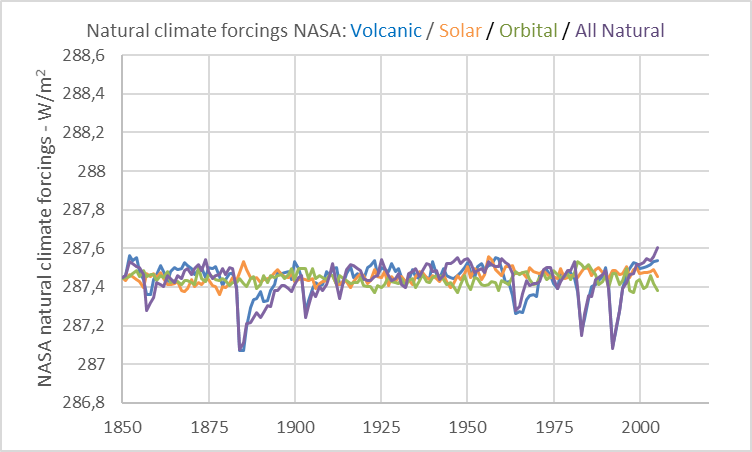
Sólo los naturales:
–
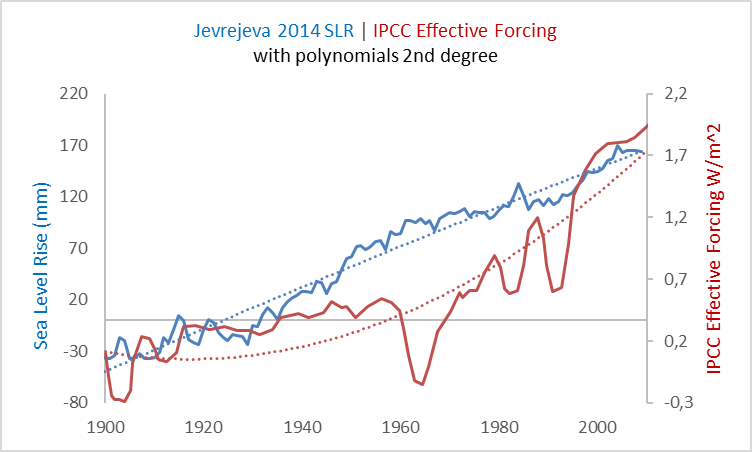
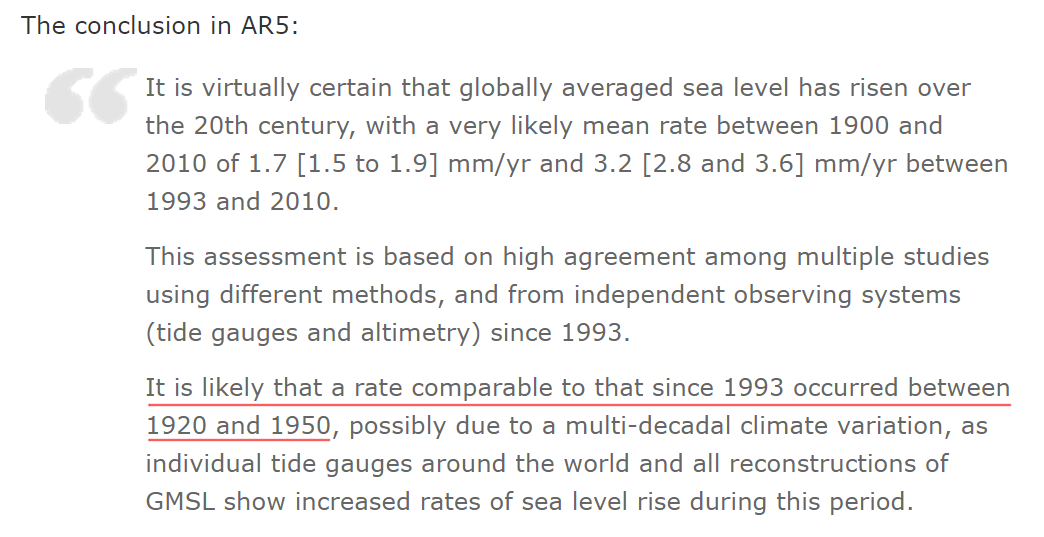
Es muy típico de los alarmistas decir que desde 1993 (lo miden también los satélites) la tasa de subida del nivel del mar (como 3,1) es como mayor que la del siglo XX (como 1,9). Y por tanto … ¡se está acelerando! Muéstrales este gráfico para darles en el morro.
Más:
- Dean y Houston: Recent sea level trends and accelerations: Comparison of tide gauge and satellite results
Whether the increased sea level trend of approximately 3 mm/year measured by the satellites since the 1990's is a long-term increase from the 20th Century value of approximately 1.7 mm/year or part of a cycle will require longer records; however, the negative accelerations support some cyclic character.Más:
- Chen, Feng y Huang: Global sea level trend during 1993–2012
GMSL started decelerated rising since 2004 with rising rate 1.8 ± 0.9 mm/yr in 2012.Deceleration is due to slowdown of ocean thermal expansion during last decade.
Recent ENSO events introduce large uncertainty of long-term trend estimation.
Más:
Más:| Dr. Jerry Mitrovica's 23 gold standard tide stations with minimal VLM, suggested by Dr. Bruce Douglas |
Más. Cálculo de servilleta de subida nivel del mar en 100 años y +3ºC (sale muy parecido que IPCC 2007 - 29 cm.):
--PSMSL
--
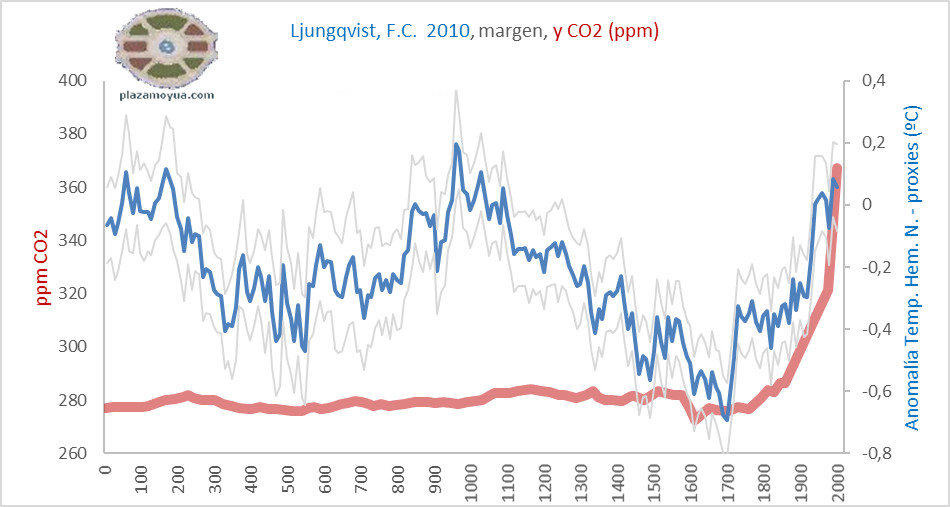
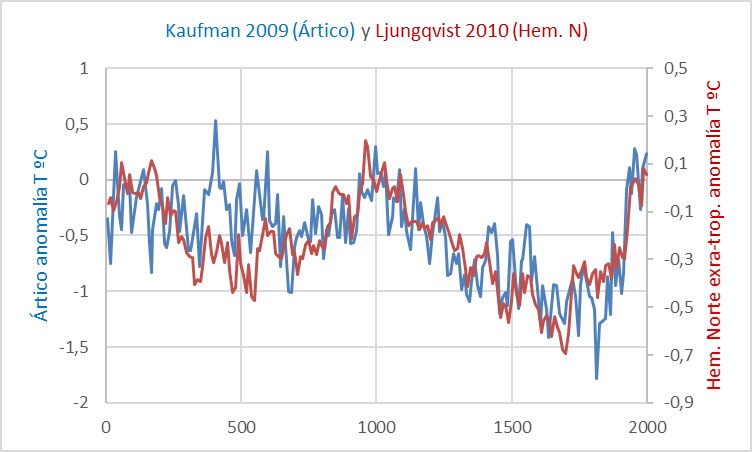
Temperatura hemisferio norte proxies (cum grano salis) Ljungqvist 2010: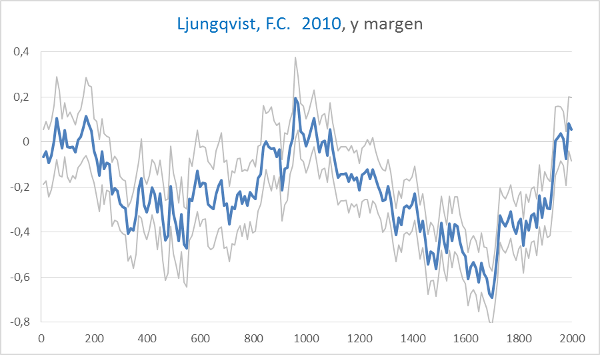
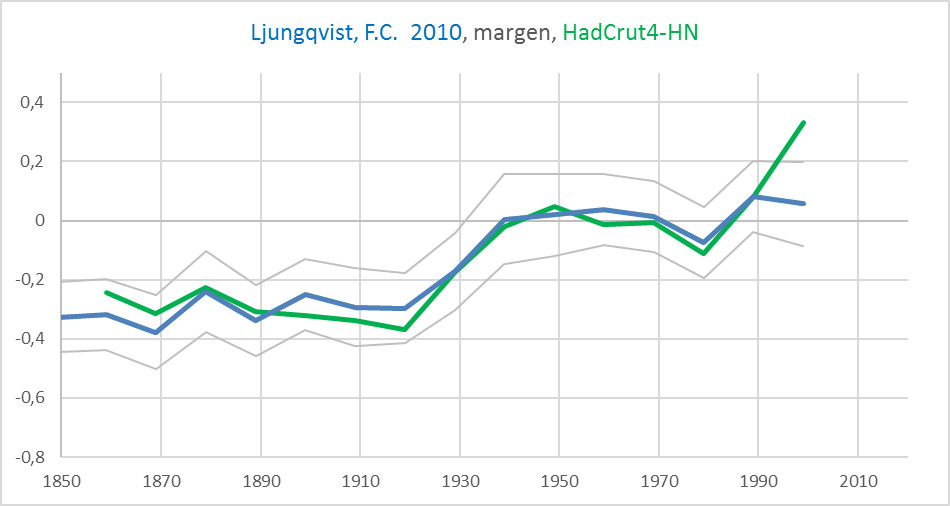
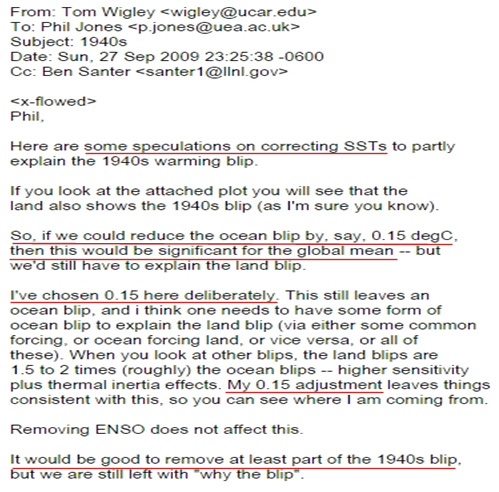
Keith Briffa (email 0938018124.txt):
There is still a potential problem with non-linear responses in the very recent period of some biological proxies ( or perhaps a fertilisation through high CO2 or nitrate input) . I know there is pressure to present a nice tidy story as regards 'apparent unprecedented warming in a thousand years or more in the proxy data' but in reality the situation is not quite so simple. We don't have a lot of proxies that come right up to date and those that do (at least a significant number of tree proxies ) some unexpected changes in response that do not match the recent warming. I do not think it wise that this issue be ignored in the chapter.For the record, I do believe that the proxy data do show unusually warm conditions in recent decades. I am not sure that this unusual warming is so clear in the summer responsive data. I believe that the recent warmth was probably matched about 1000 years ago.
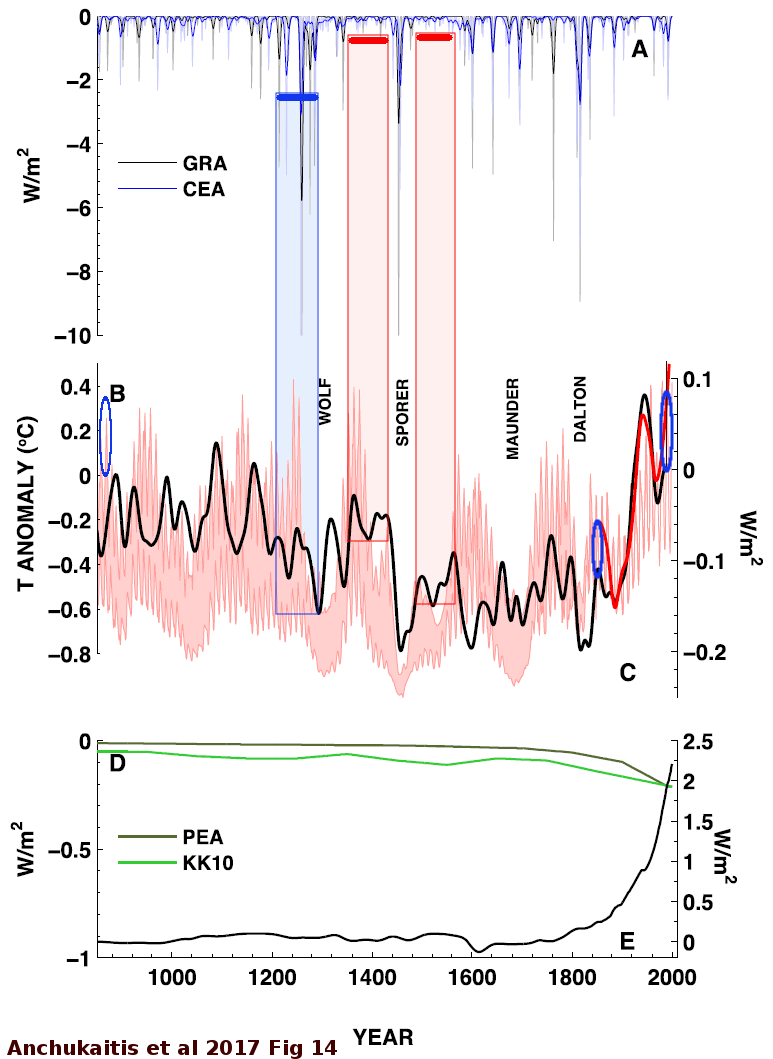
Anchukaitis et al 2017:
–
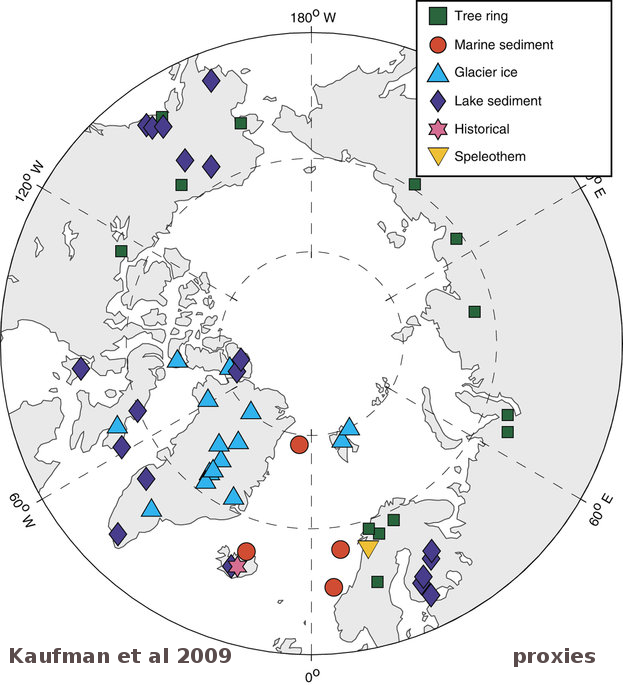
Ártico. Kaufman, Pages 2k.
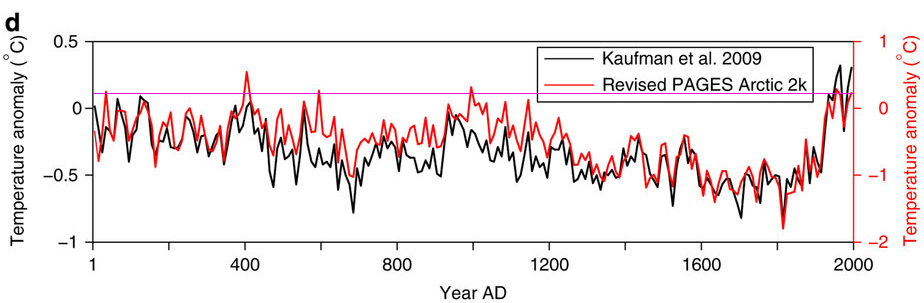
Ljungqvist + Kaufman
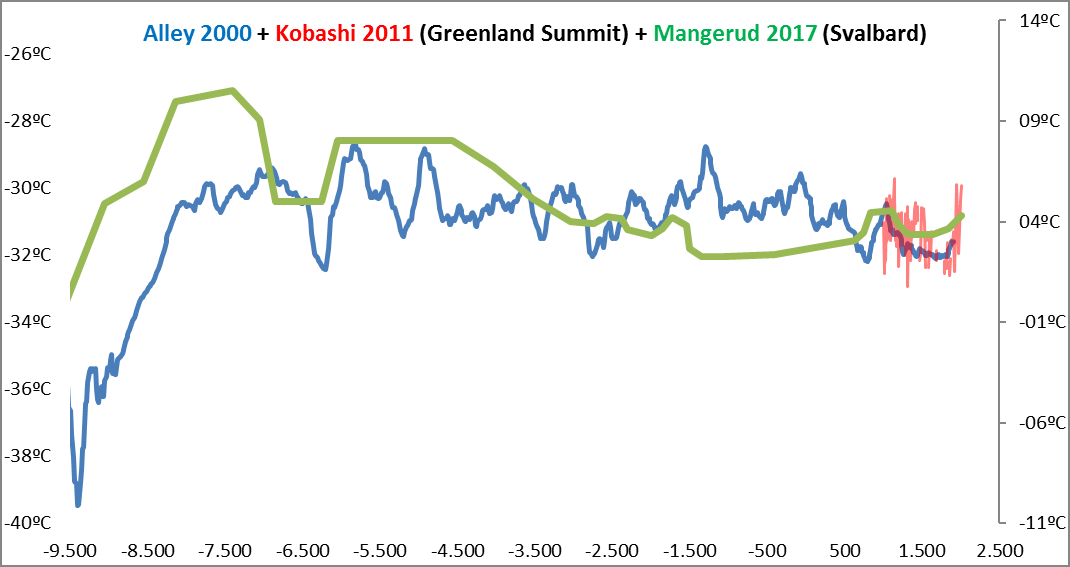
Lo último de Kobashi / Summit - Groenlandia:
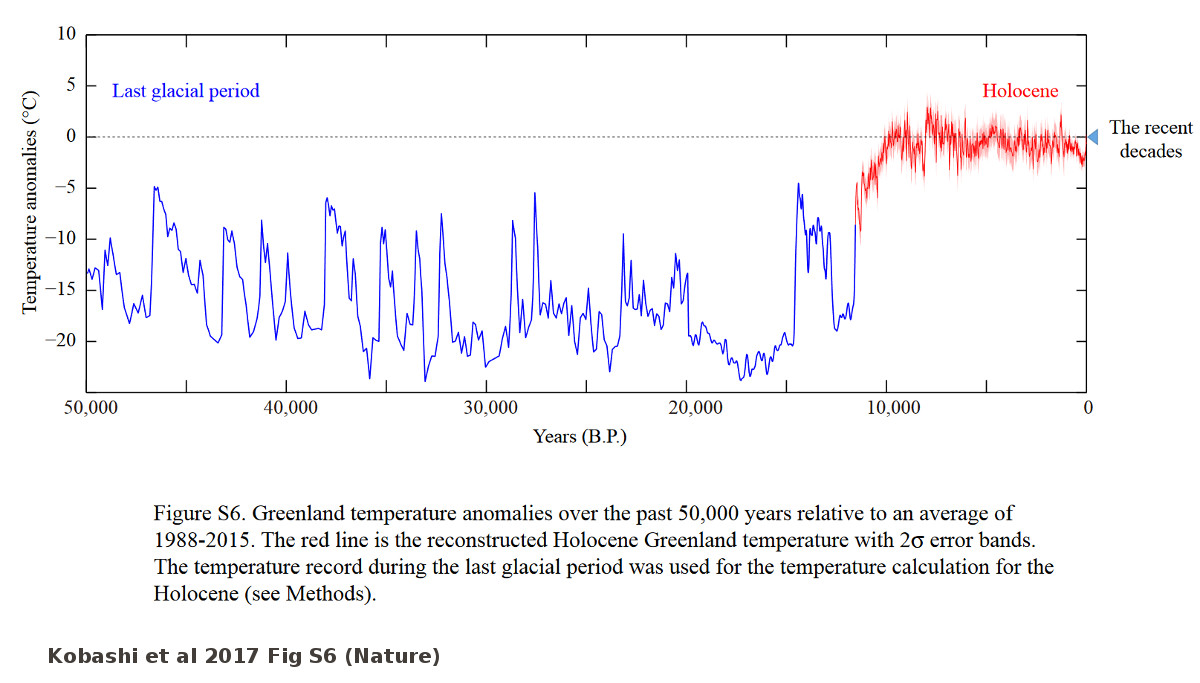
- https://www.nature.com/articles/s41598-017-01451-7#supplementary-information
- http://sci-hub.tw/10.1177/0959683617715701
–
Coral:
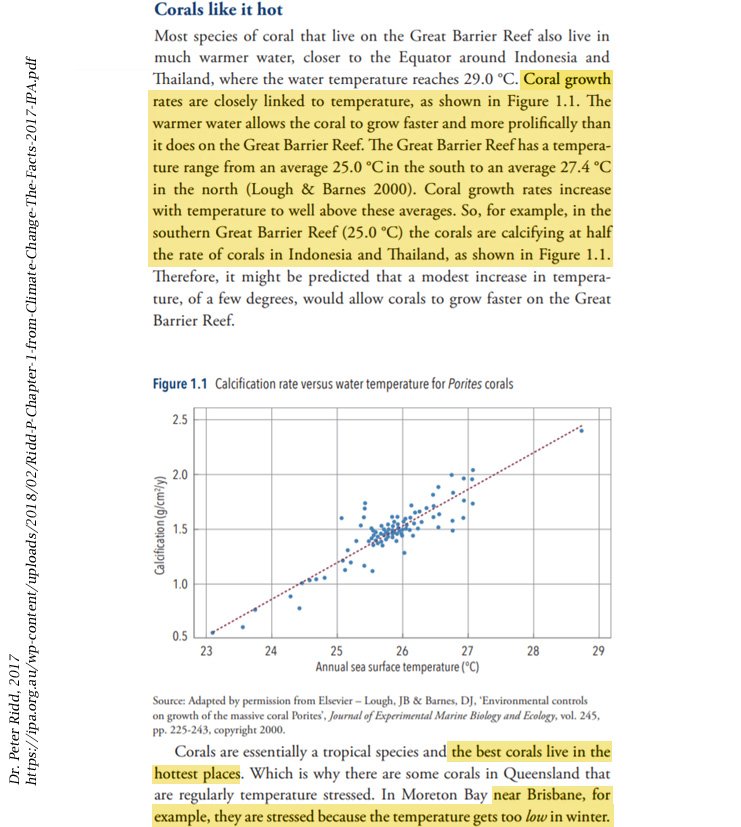
El coral sufre por el “cambio climático” … ¿de verdad?

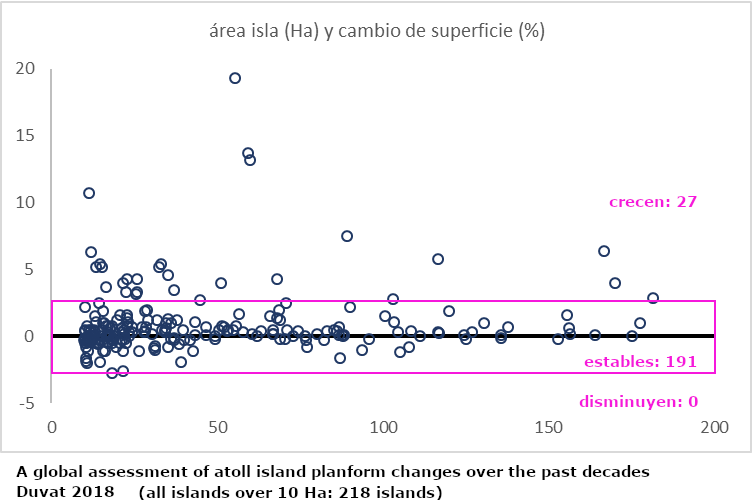
Y las islas del Pacífico que desaparecen:
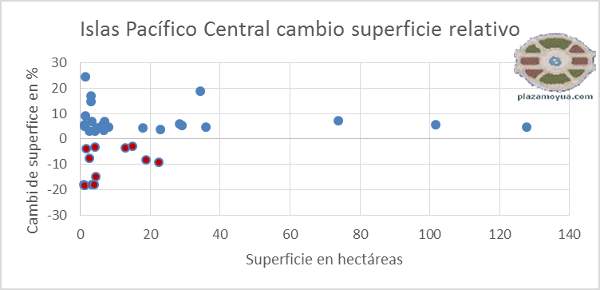
De Duvat 2018, las islas de más de 10 Ha.
–
-- --Lo que le importa la acidificación al coral (nada). El asunto cambia enteramente cuando se hacen experimentos en el medio natural en lugar de laboratorios.
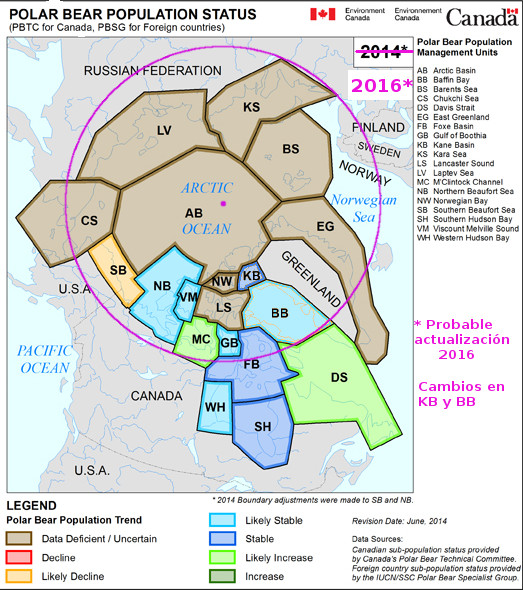
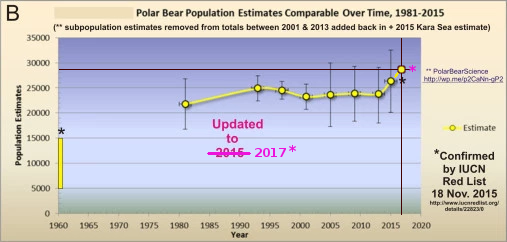
En CO2 Science: --Hielo y Osos
Poblaciones: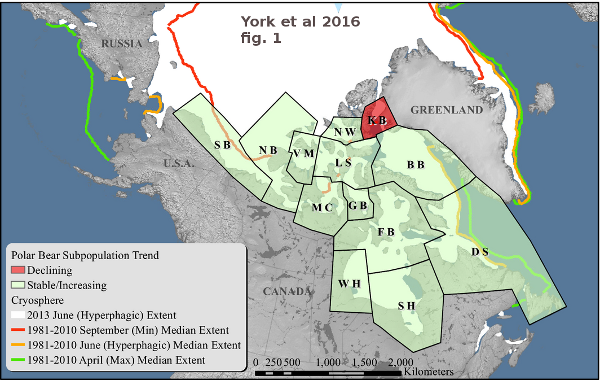

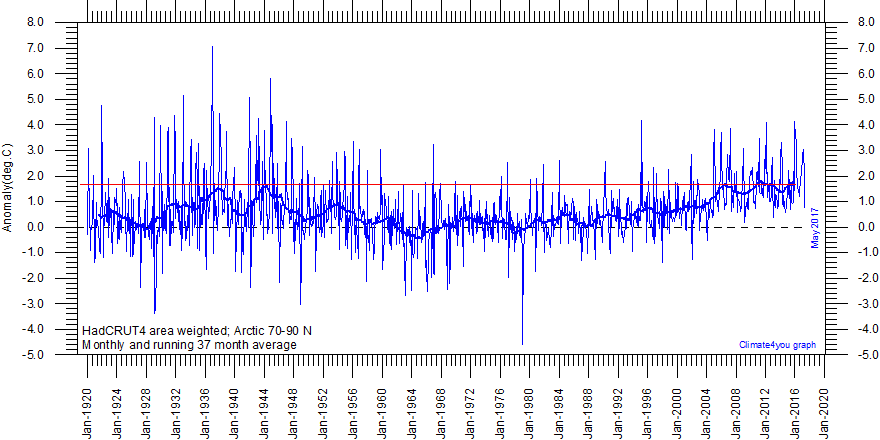
Temperatura del Ártico HadCrut4:
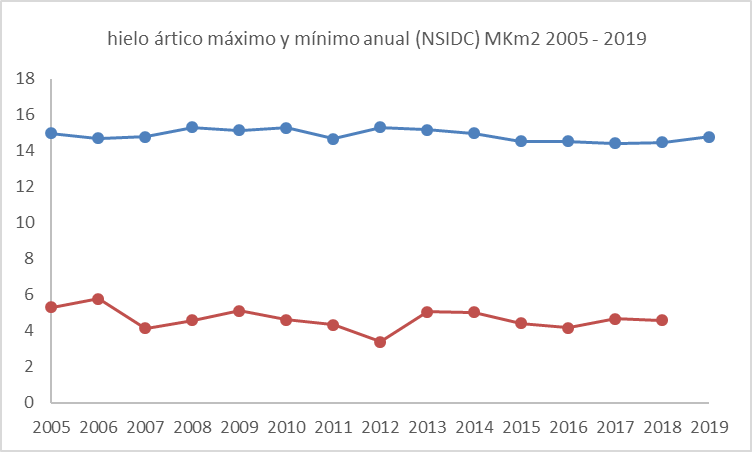
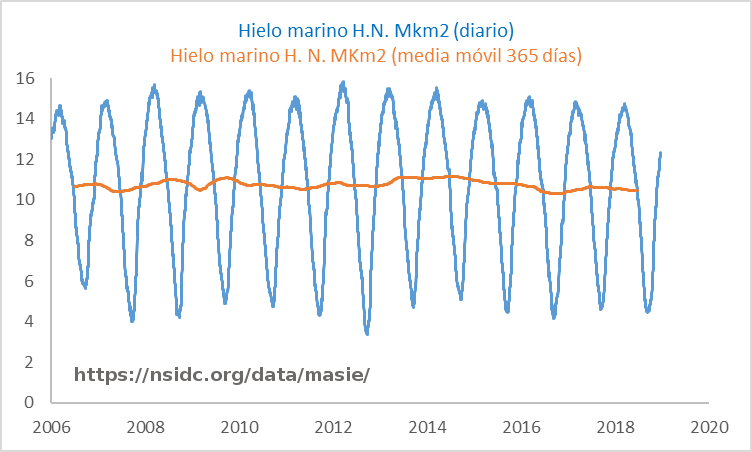
Hielo marino del Ártico en Km2 según NSIDC / MASIE
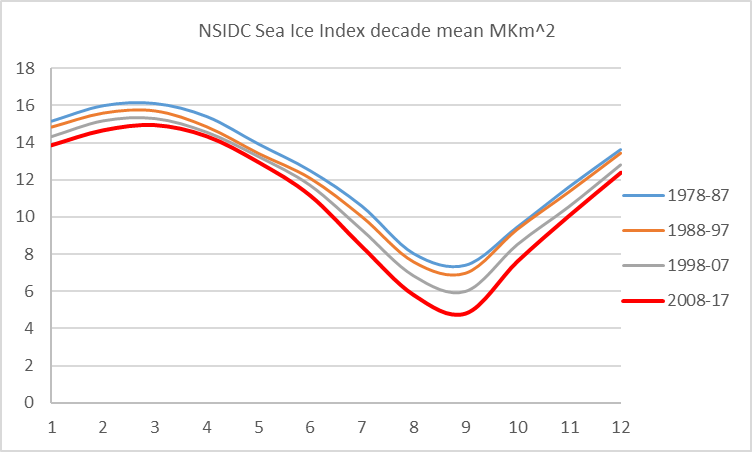
El estilo “ola” habitual, NSIDC Sea Ice Index, últimos 10 años:
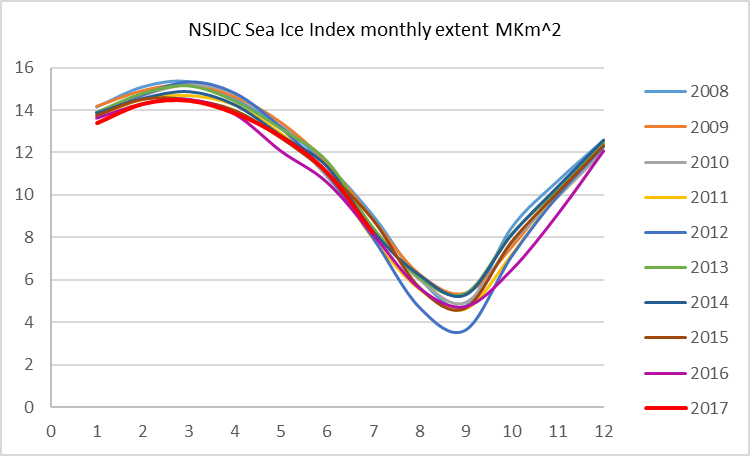
Lo mismo, por décadas:
–
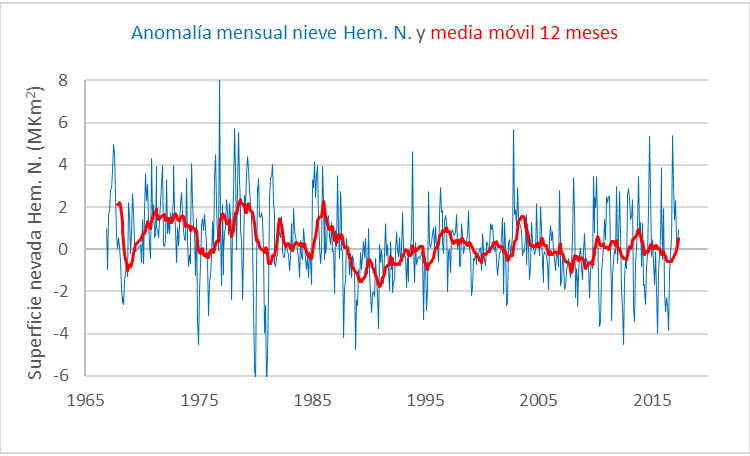
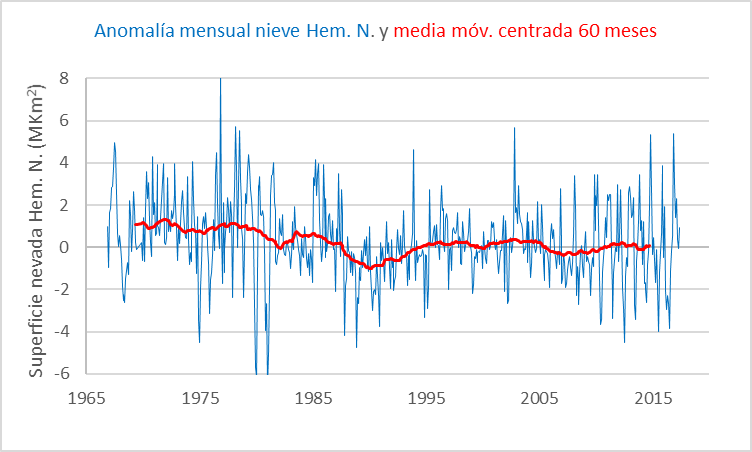
Y algo de nieve, ya puestos:
–
La canonización científica de “hechos” falsos
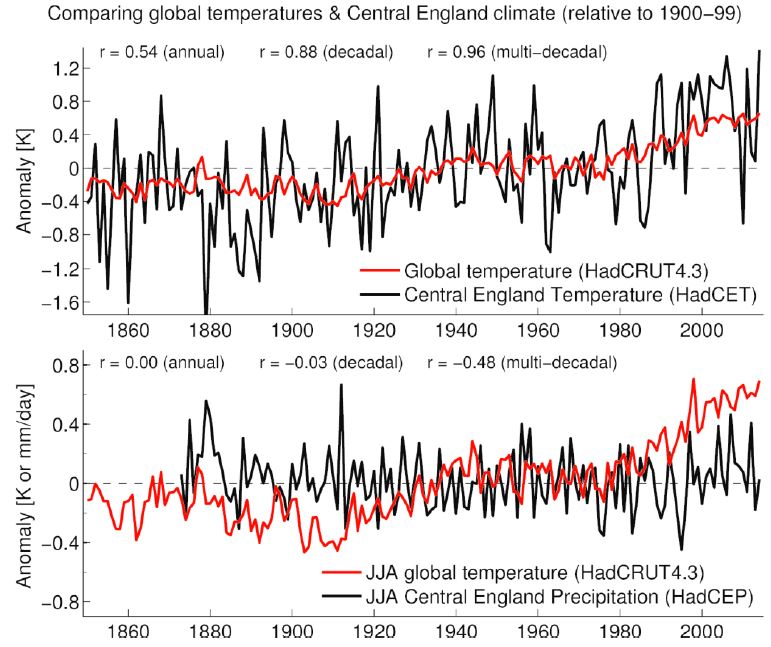
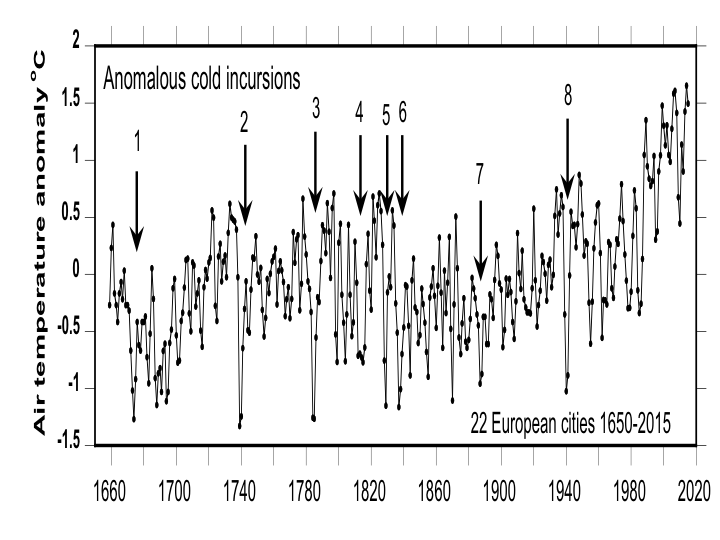
--Sobre “local” y “global”, por ejemplo CET.
–
TREND PROFILES OF ATMOSPHERIC TEMPERATURE TIME SERIES (Jamal Munshi)
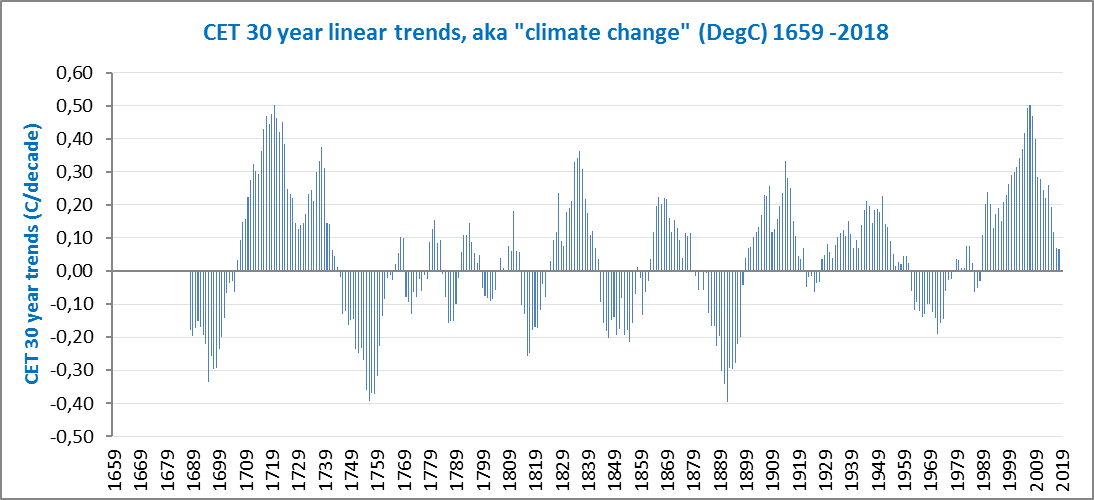
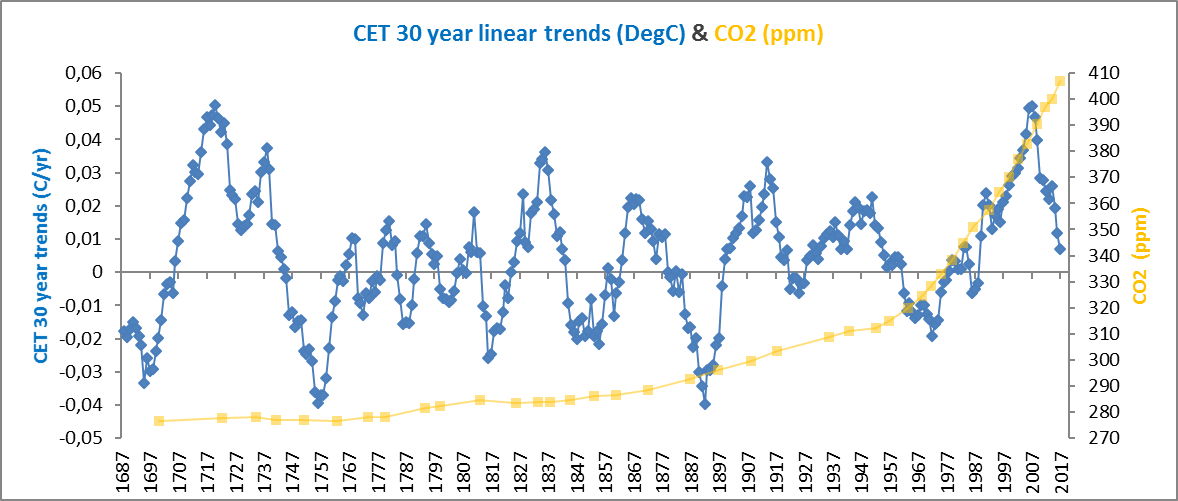
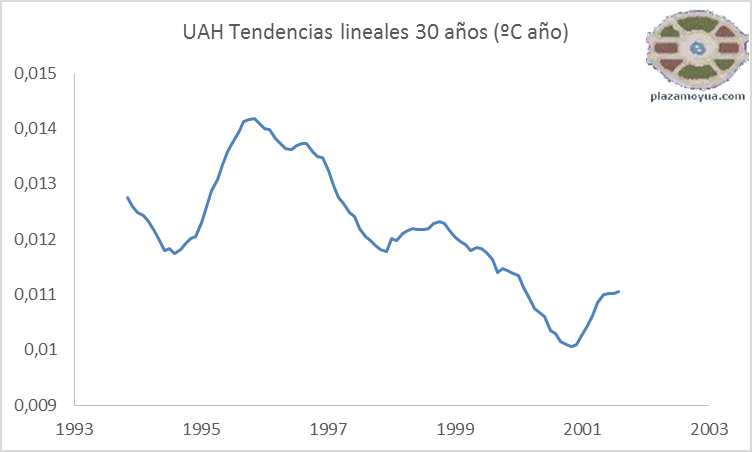
CET tendencias 30 años 1659 -2018:
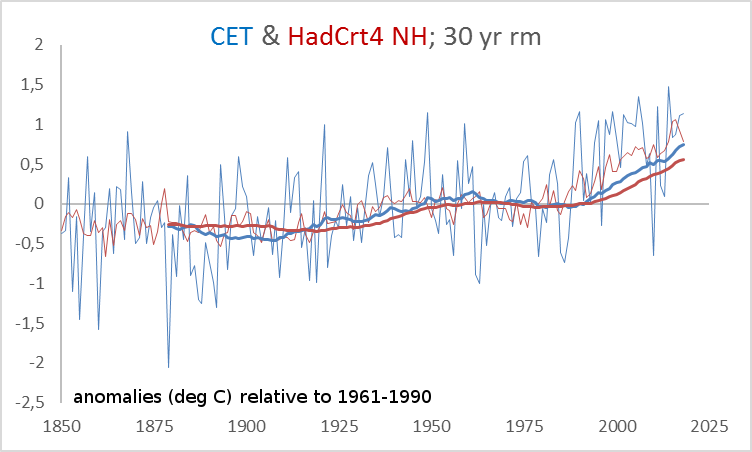
CET como proxy del hemisferio norte en medias de 30 años:
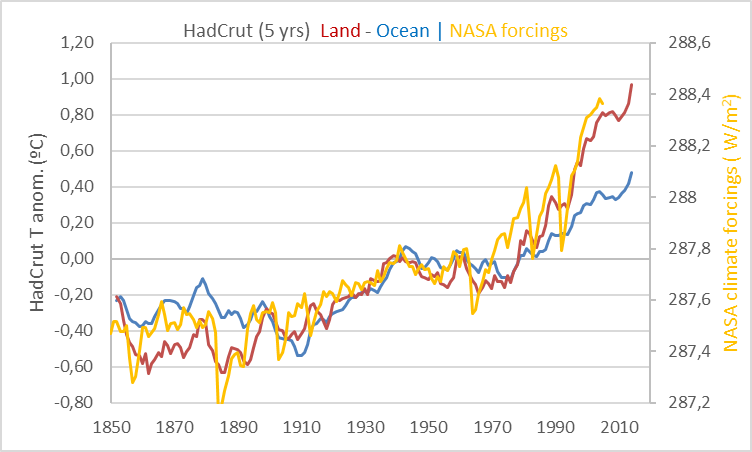
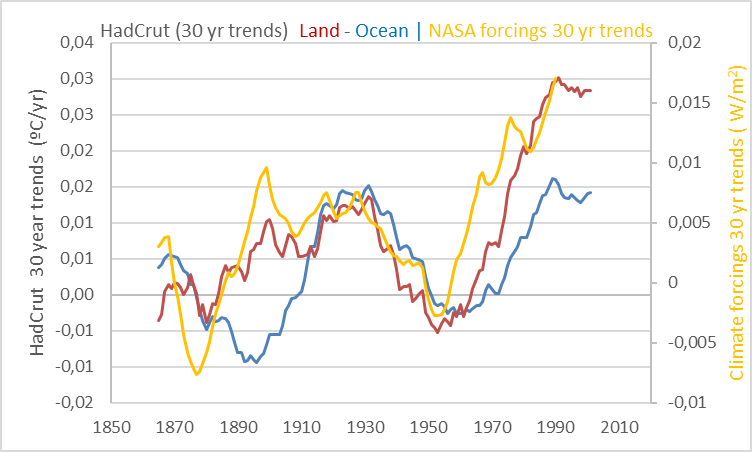
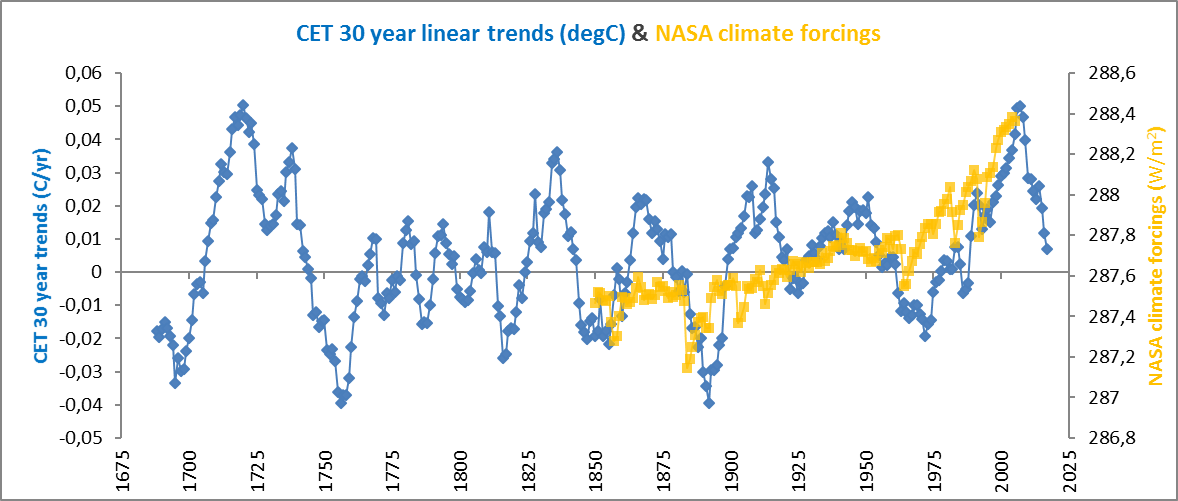
CET y forzamientos NASA:
–
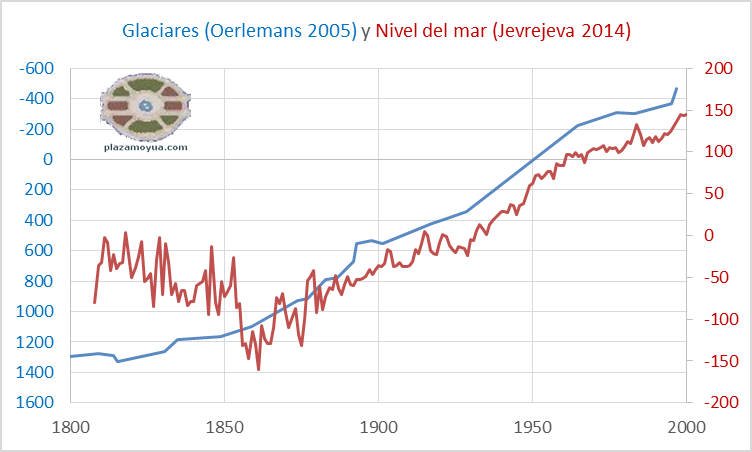
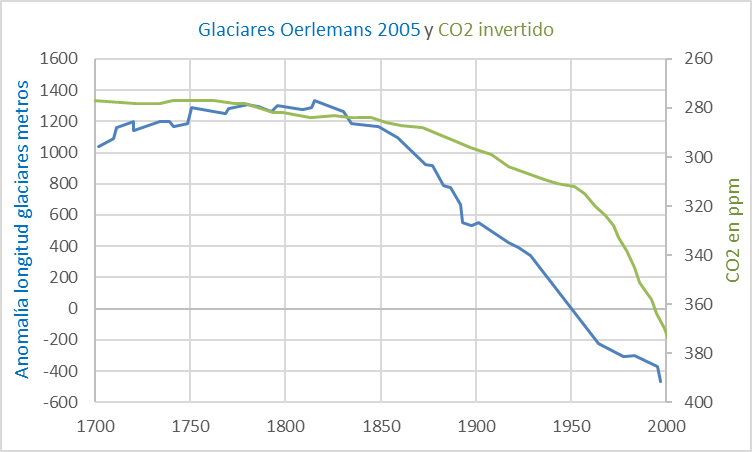
Glaciares y nivel del mar:
–
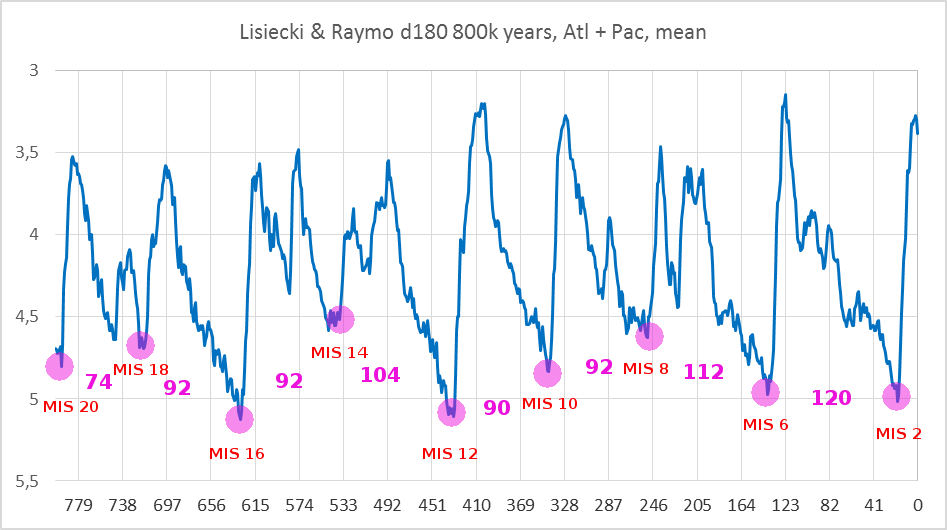
La “prueba” del Calentamiento Global Acojonante a la vista de cualquiera (es en serio)
--¿Cuáles son las “terminaciones” que cuentan?
–
Informe Stern, diez años después (GWPF)
--
https://www.youtube.com/watch?v=fOt6CoSy78c
–
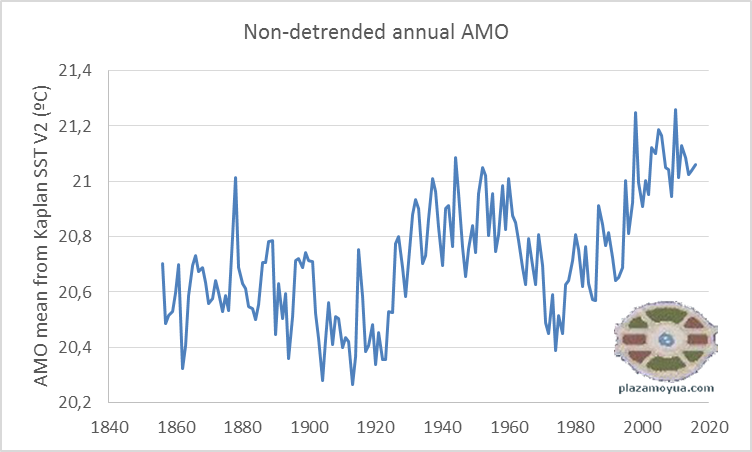
Greg Norman AMO trends (un truco muy estilo IPCC para “acelerar” lo que no tiene aceleración).
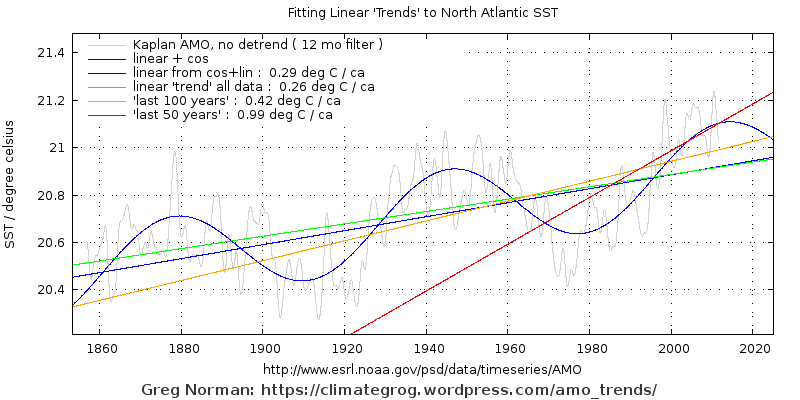
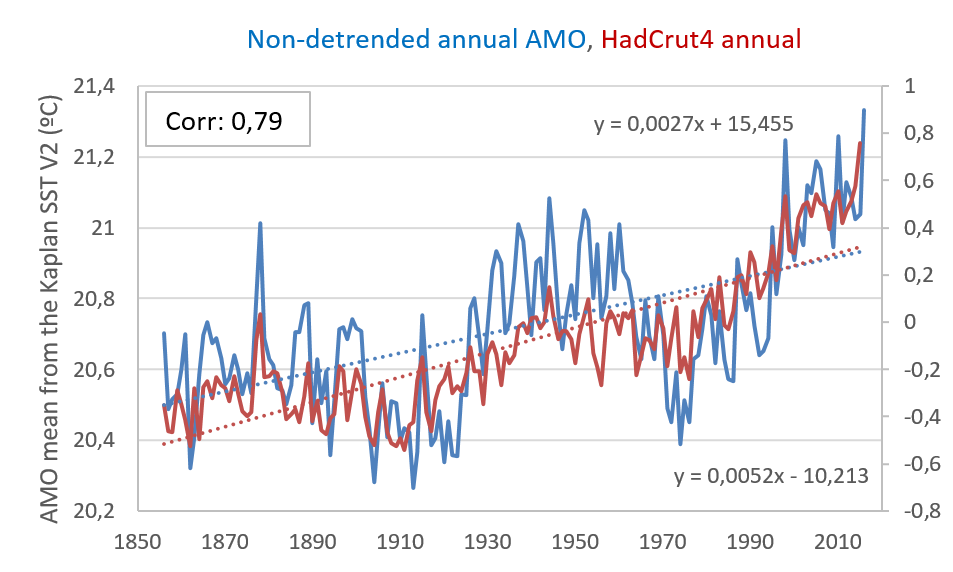
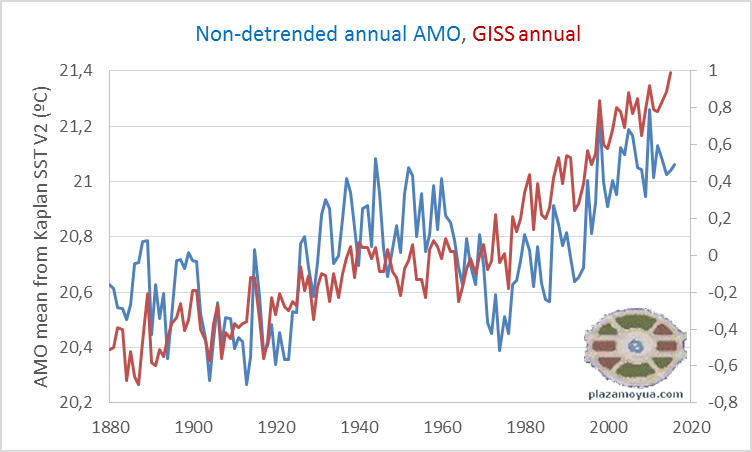
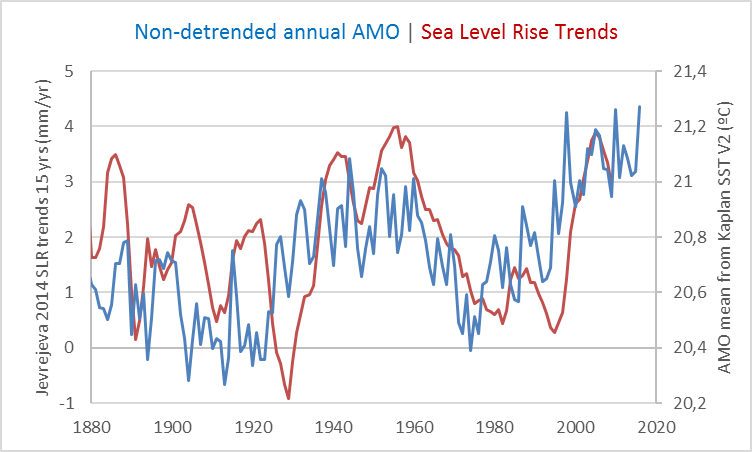
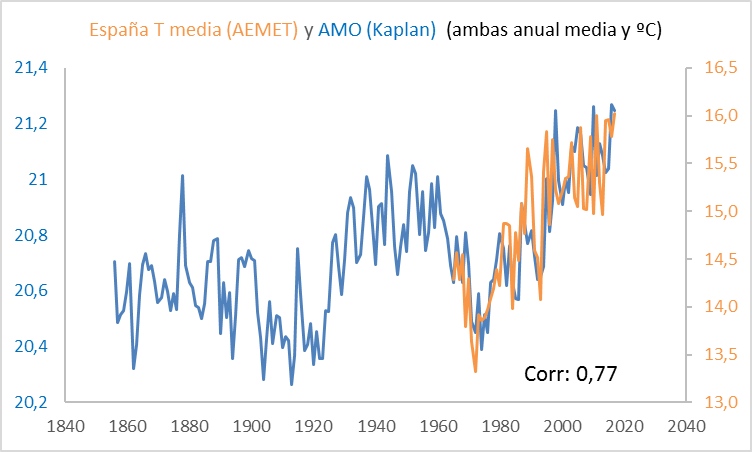
Y ya que estamos con AMO:
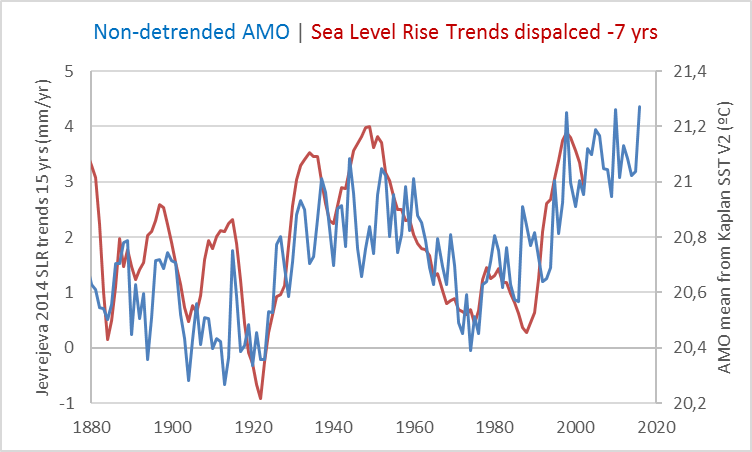
AMO y T España:
–
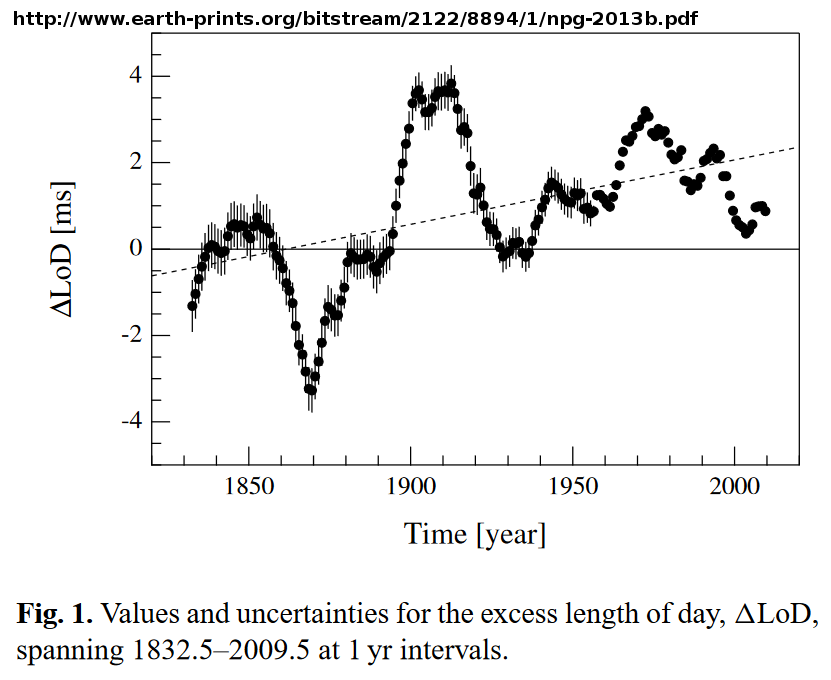
LOD (Michelis, Tozzi, Consolini - http://www.earth-prints.org/bitstream/2122/8894/1/npg-2013b.pdf).
–
Vukcevic:
Viterito: --Una “ciencia establecida”
–
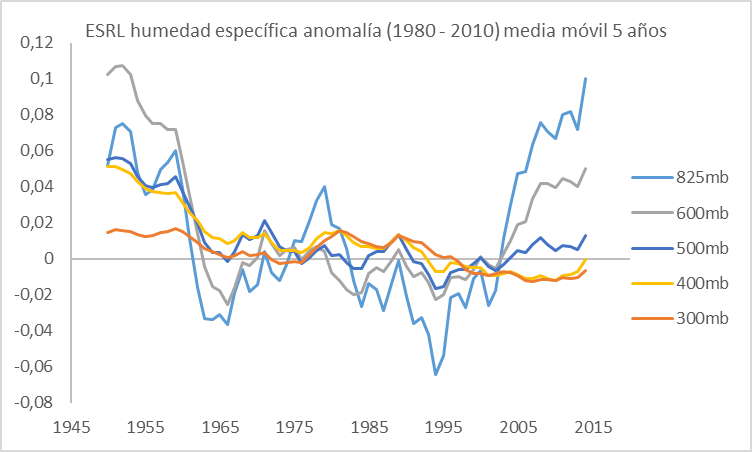
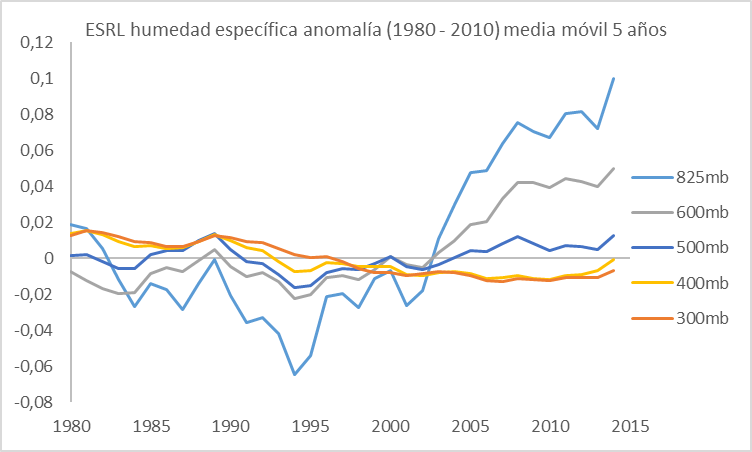
ESRL humedad específica:
–
–
Dynamics of Green Sahara Periods and Their Role in Hominin Evolution
–
Extremos climáticos, datos IPCC por Pielke Jr. (hay que seguir el hilo).
https://twitter.com/RogerPielkeJr/status/851081993085497344
–
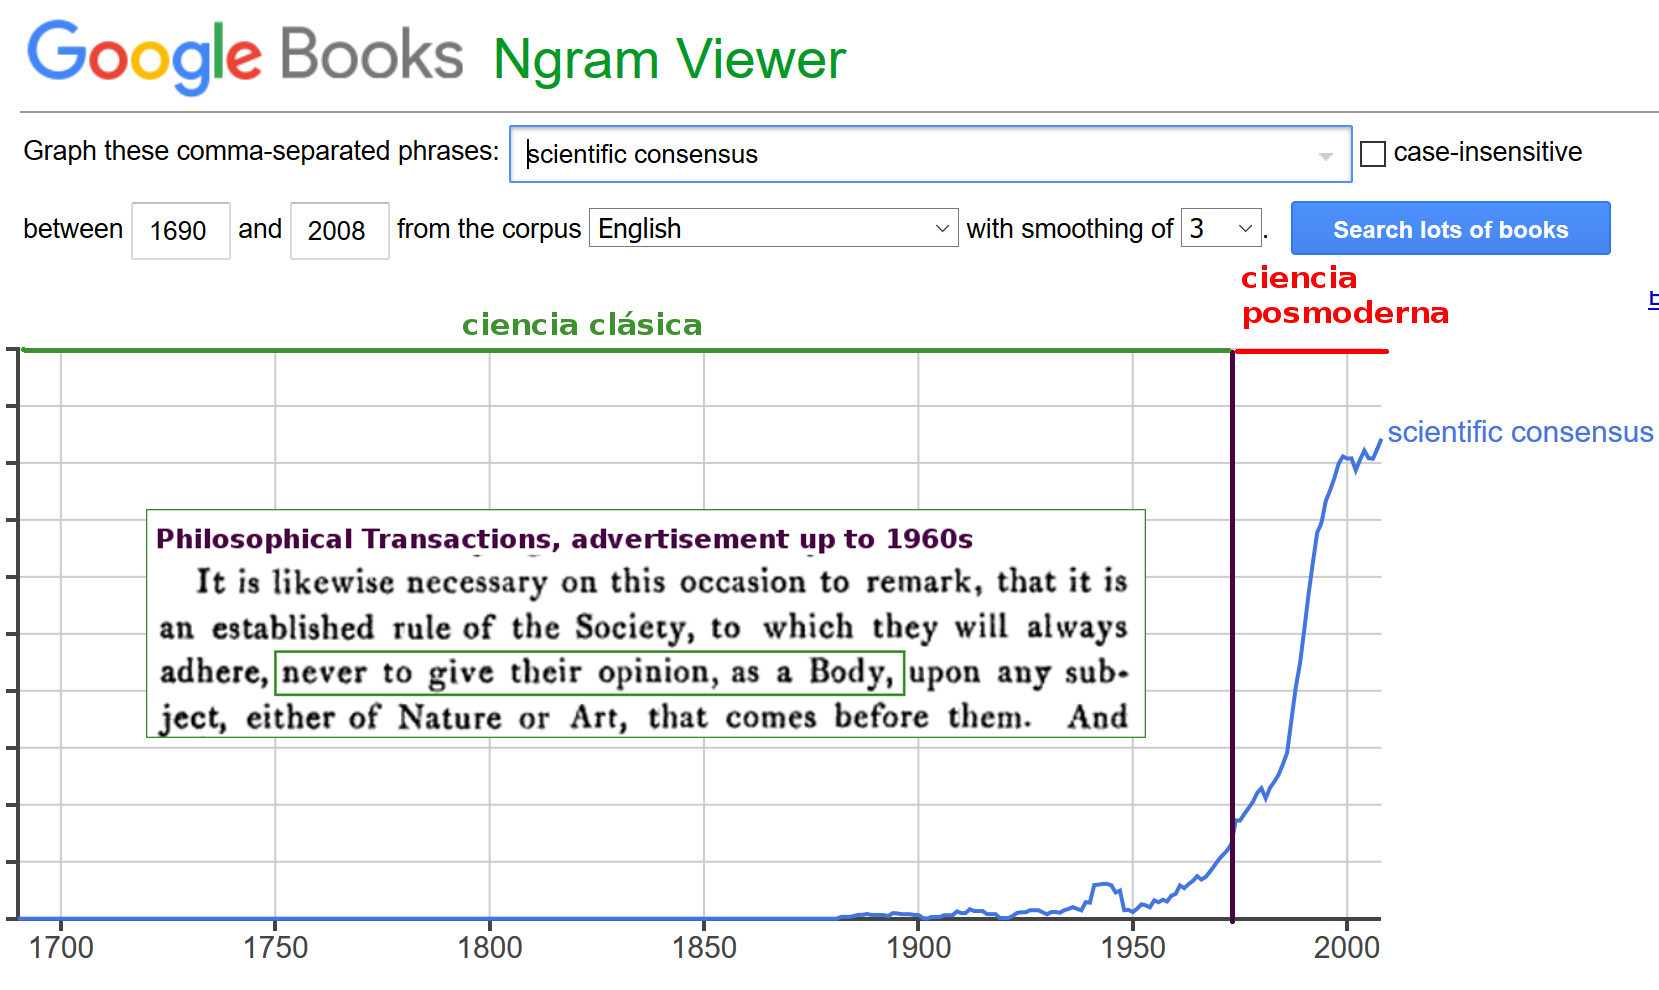
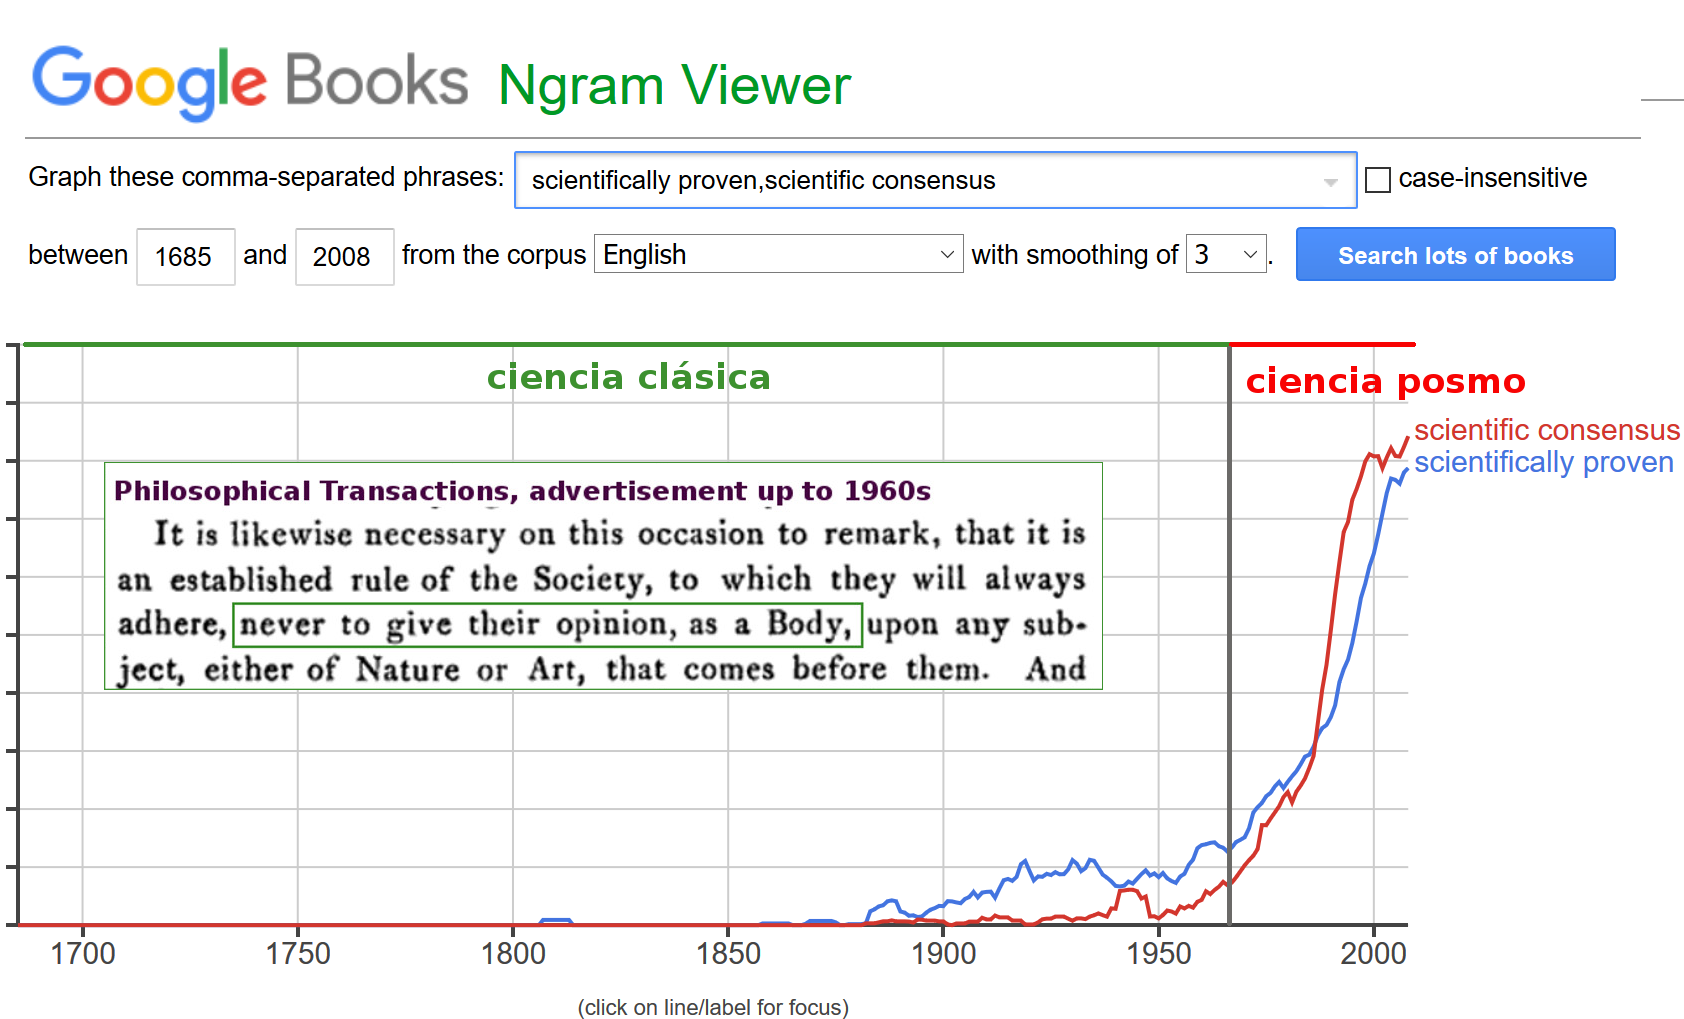
Evidencia cambia de significado con la ciencia posmo:
–
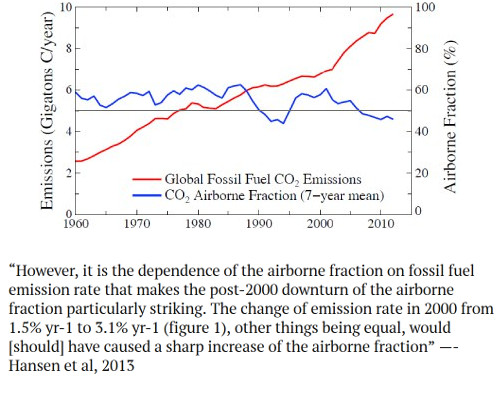
CO2 airborne fraction:
–
Climate change and the Syrian civil war revisited
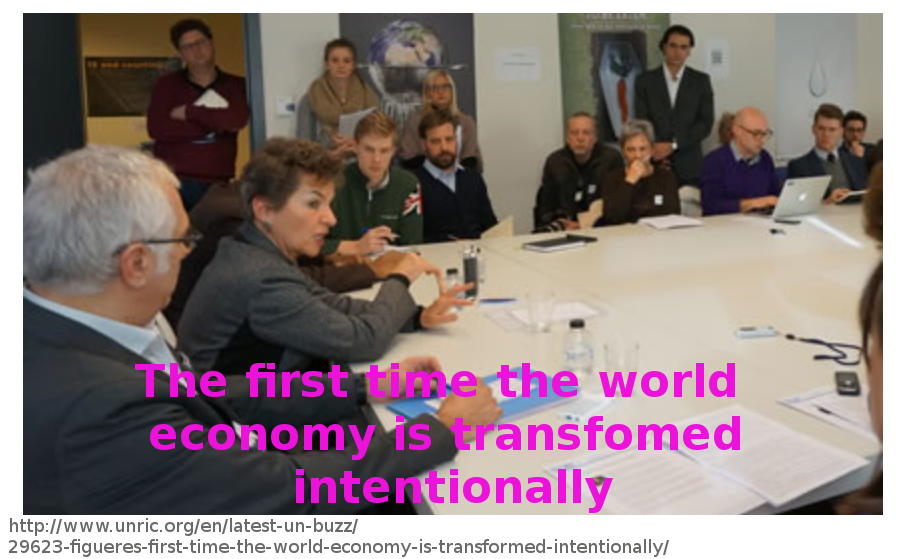
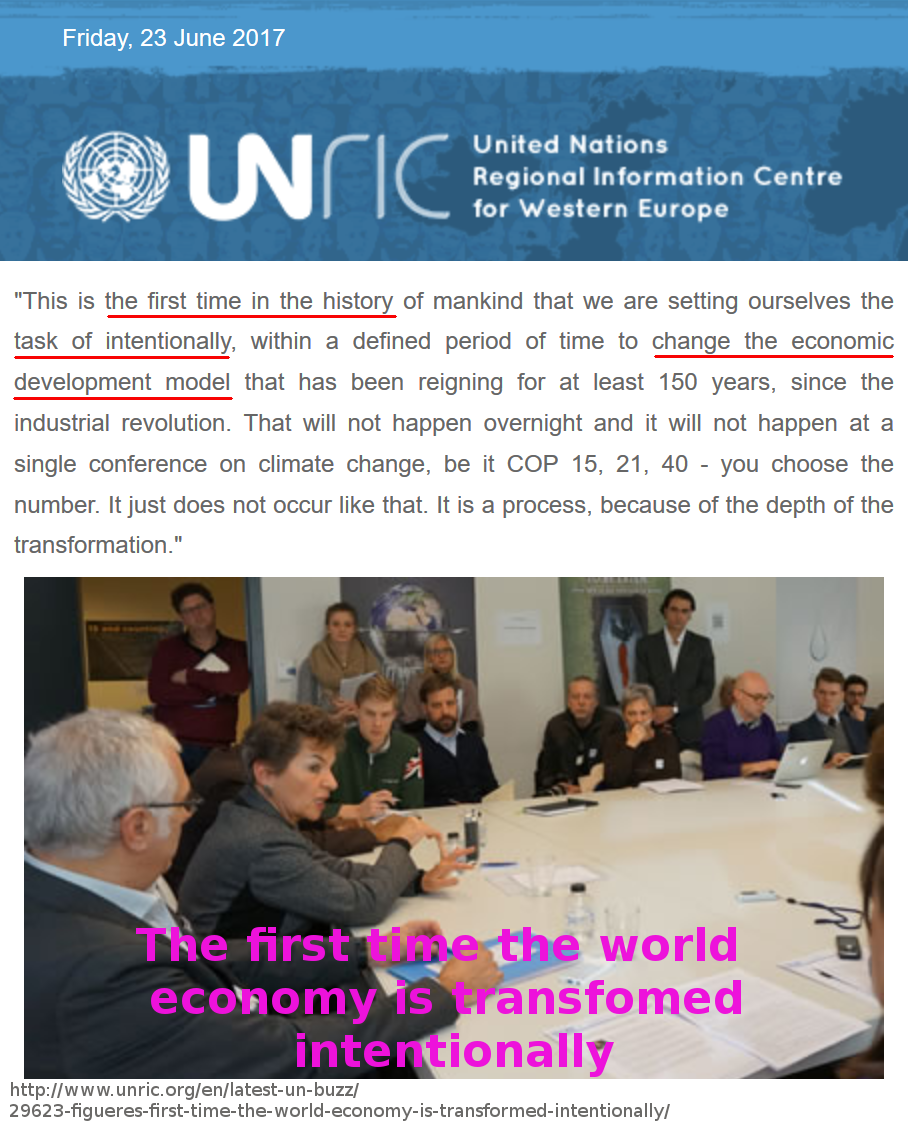
--La verdadera naturaleza de cuento. Figueres y su economía.
–
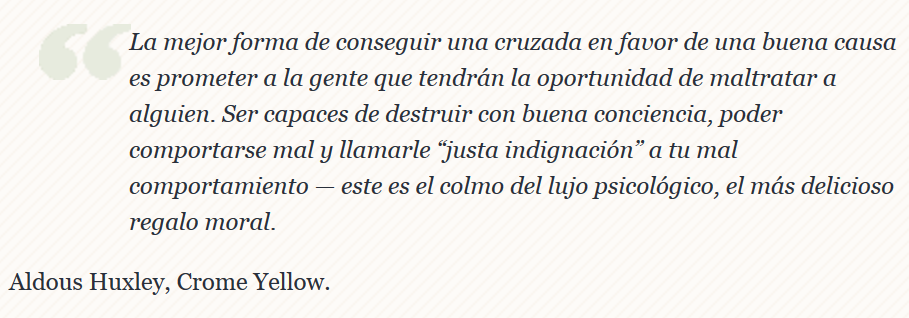
Huxley, regalo moral:
Versión John Cleese:
https://www.youtube.com/watch?v=HLNhPMQnWu4
–
Random Walk:
AMS (A.H. Gordon)
--Leif Svalgaard: